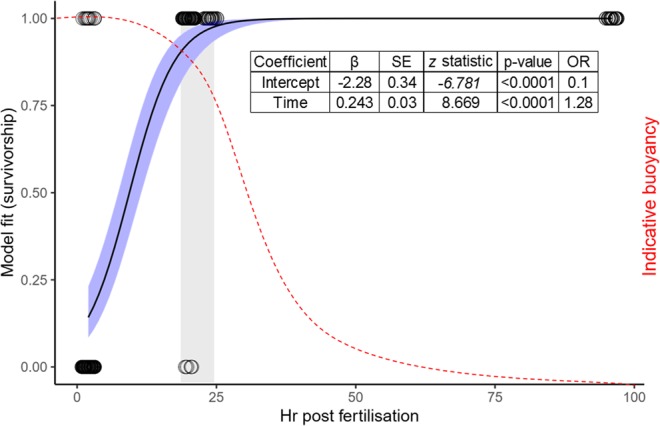
Figure 2.

Survival of agarose-embedded Montipora digitata embryos (points are jittered horizontally for clarity) plotted against hours after fertilisation with a logistic model fitted to the data (black curve). Blue shading represents the 95% confidence interval around the model. Red curve indicates the indicative buoyancy of embryos/larvae for many coral species. Grey shading indicates optimal theoretical window for embedding from 19–24 hr corresponding with an estimated 95–99% survival and high larval buoyancy. Model coefficients are presented in the inset table. SE = standard error; OR = odds ratio.
