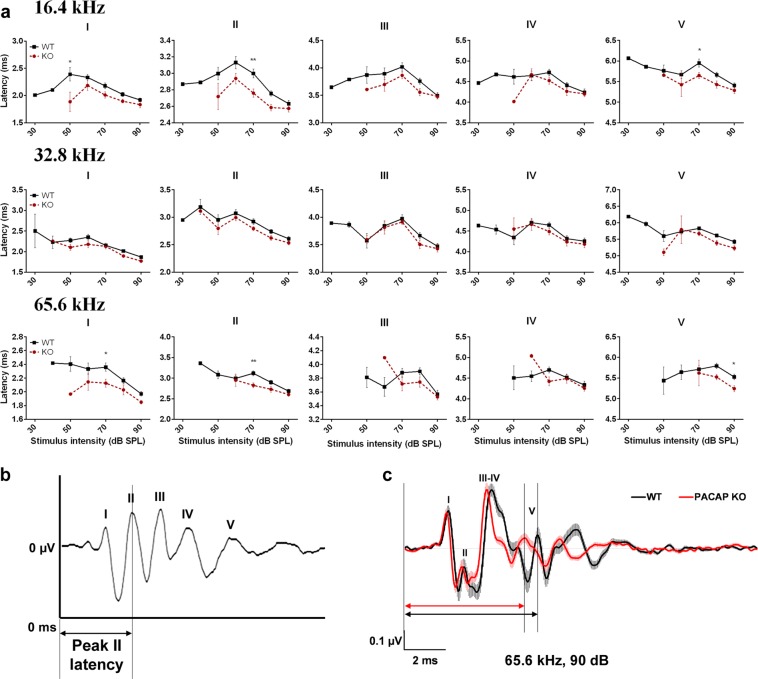
Figure 3.
Genotype-dependent differences in the auditory brainstem response (ABR) latency-intensity profiles of PACAP-deficient (KO) and wild-type (WT) mice at 16.4, 32.8 and 65.6 kHz. (a) Asterisks indicate significant differences between KO and WT mice. Mean ± SEM; 2-way-ANOVA, Bonferroni post-hoc test. **p < 0.01, *p < 0.05 vs. WT values at the corresponding stimulus frequency and intensity. (b) Example for absolute latency measurement at peak II. (c) Average traces (±SEM) at 65.6 kHz, 90 dB demonstrate the waveform and latency differences between WT and KO mice. Two-headed arrows (↔) demonstrate the difference between peak V latency values (black: WT, red: KO).

