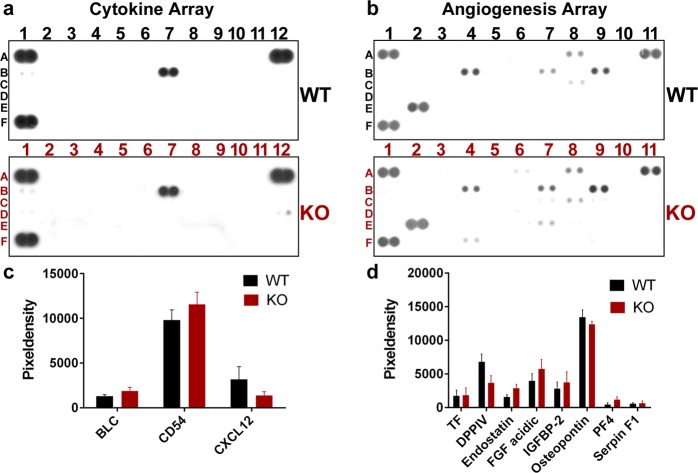
Figure 8.
Proteome profile analysis of cochlear duct lysates with R&D Mouse Proteome Profiler Mouse Cytokine Array Panel A (a,c) and Mouse Angiogenesis Array Kit (b,d). (a,b) Representative images for Cytokine Array Panel A (B1: BLC, B7: CD54, D12: CXCL12) and Angiogenesis Array Kit (A8: TF, B4: DPPIV, B7: endostatin, B9: FGF acidic, C8: IGFBP-2, E2: osteopontin, E7: PF4, F4: serpin F1). See Supplementary Table S2 for identification of all measured proteins. (c,d) Pixel density of protein dots acquired from cochlear duct lysates. There were no significant differences in either examined factors between wild-type (WT) and PACAP-deficient (KO) mice. Mean ± SEM, Student’s t-test.

