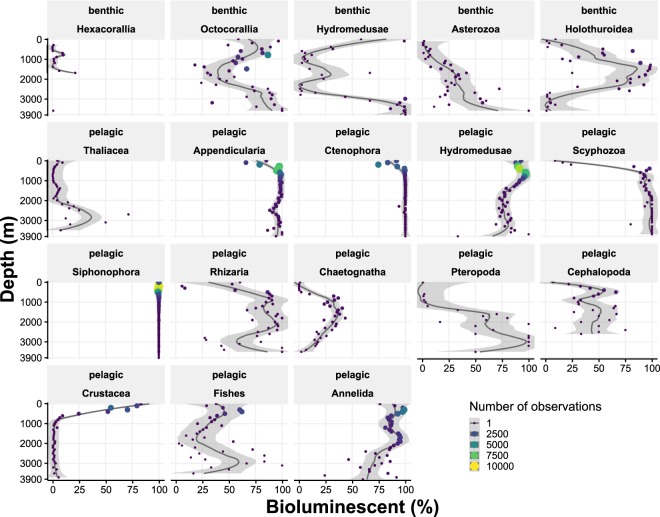
Figure 5.
Profiles of the percentage of bioluminescent and likely-bioluminescent individuals per group and by depth. Only taxa observed at more than 4 different depths have been represented (benthic Arthropoda, Fishes and Hydroidolina have been removed). The black line represents a local loess regression (span = 0.5) with the grey bands being the 0.95 confidence interval around the smooth fit. The size and color scale show the maximum number of observations per class, used to weight the regression.

