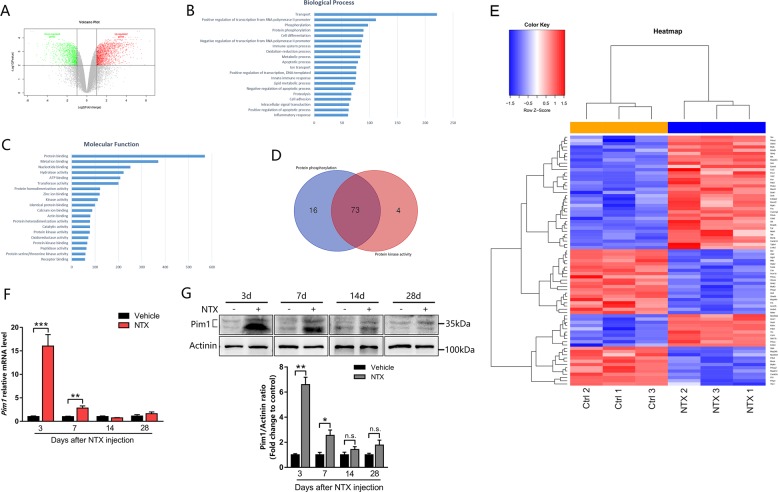
Fig. 1. Pim1 kinase is upregulated after skeletal muscle injury.
a Volcano plots of differentially expressed genes (DEGs) in normal muscle and damaged muscle samples in GSE67032. DEGs were selected by P-value < 0.01 and |log2 (fold change)| ≥ 1. The x‑axis corresponds to log2 (fold change), and y‑axis corresponds to −log10 (P-value). b, c Gene ontology (GO) analysis of identified DEGs. Top 20 biological process b and molecular function c. d Venn diagrams illustrating the number of common DEGs that participate in both protein phosphorylation and protein kinase activity. e Heat map of the 73 differentially expressed protein kinases that participate in protein phosphorylation in GSE67032. Red: upregulated kinases; blue: downregulated kinases. f, g qPCR and western blot analysis of Pim1 mRNA f and protein g levels in the TA muscle at 3, 7, 14, and 28 days after notexin (NTX) injection (n = 4). The data are shown as mean ± SEM. Independent-samples t-test. *P < 0.05; **P < 0.01; ***P < 0.001; n.s. = not significant

