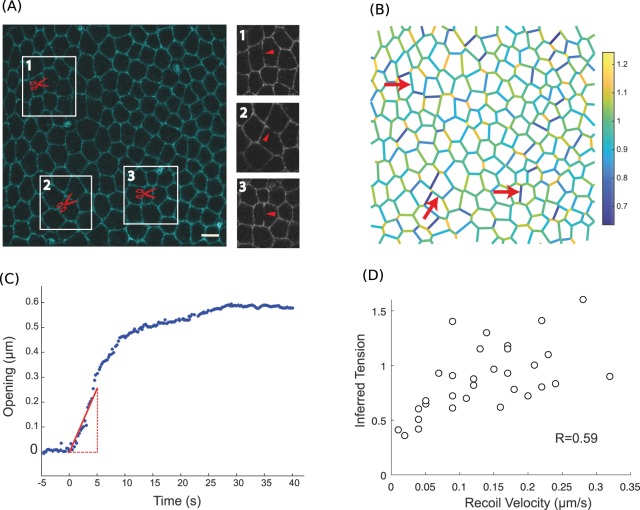
Figure 1.
Force inference at the single junction scale in the Drosophila notum. (A) Subregion of the Drosophila notum 21 h after pupa formation. Scissors show ablation spots where recoil velocities will be measured. Insets show post-ablation snapshots of the considered junctions. Scale bar: 5 μm. (B) Inferred tension map of the tissue region in (A) before the ablations. Red arrows indicate the location of ablations, where inferred tensions are extracted and compared to experimental recoil velocities. (C) Opening dynamics and initial recoil velocity. The red line shows a linear fit of the first 5 seconds, which is used to determine the initial recoil velocity. (D) Inferred tension vs. opening velocity (N = 31 laser cuts from 10 pupae). Pearson’s correlation coefficient is 0.59. Spearman’s correlation coefficient is 0.63.

