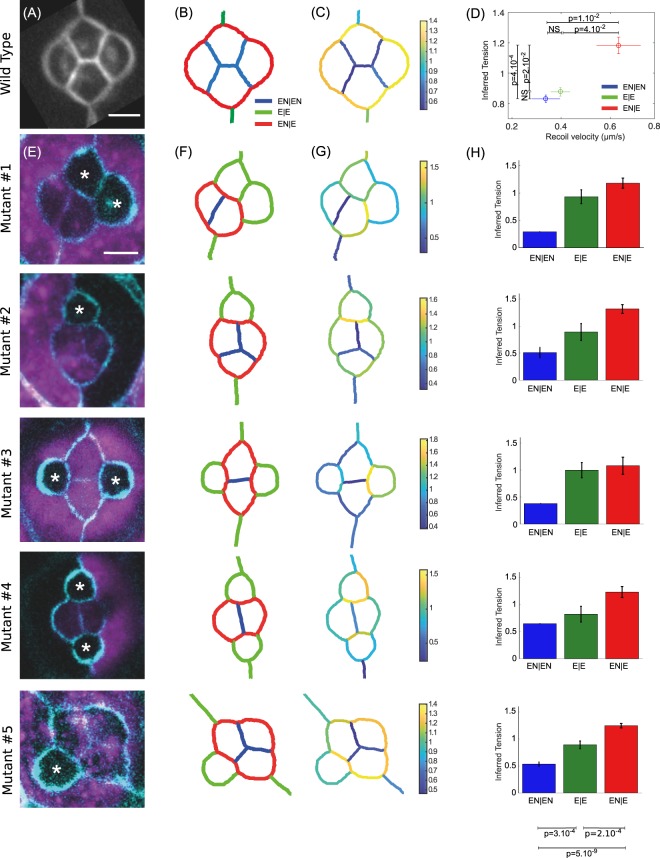
Figure 2.
Force inference in the Drosophila retina. (A) The four cone cells of a WT ommatidium. The image results from an average over N = 51 ommatidia. Scale bar: 5 μm. (B) Segmented version of (A), and nomenclature of the junction types: EN|EN junctions in blue, E|E in green, and EN|E in red. (C) Map of inferred tensions. (D) Mean inferred tension vs. mean recoil velocity for each junction type (EN|EN: N = 19, E|E: N = 16, EN|E: N = 22). (E) Five different mutant configurations generated from the mosaic experiments. WT cells are in purple. Starred cells do not express N-Cad. This only affects cone cells, as surrounding cells do not express N-Cad. Scale bar: 5 μm. (F) Pattern of junction types for each configuration. (G) Map of inferred tension in a single ommatidium for each configuration. (H) Average inferred tension for each junction type in each configuration (statistical tests at the bottom pull the five mutant configurations together).

