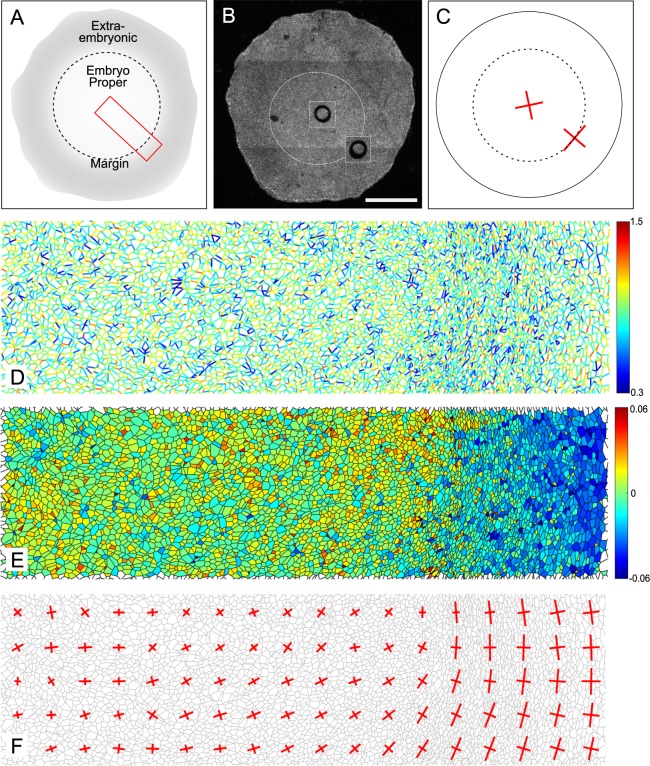
Figure 3.
Tissue-scale force inference in the quail embryo. (A) Schematics of the embryonic and extra-embryonic territories. The red box shows the radial region analyzed with force inference. (B) Typical regions used for ablations in the embryonic region and in the posterior margin region. Images 2 minutes after a cut are superimposed on the original image. Scale bar: 1 mm (C) Strain measured in the embryonic and margin regions 2 minutes after the cut (N = 7 from 4 embryos). Red crosses show the principal directions and amplitudes of tissue strain measured 2 minutes after the cuts. (D) Map of inferred tensions. (E) Map of inferred pressures. (F) Map of inferred stress. Red crosses show the principal directions and amplitudes of the stress tensor.

