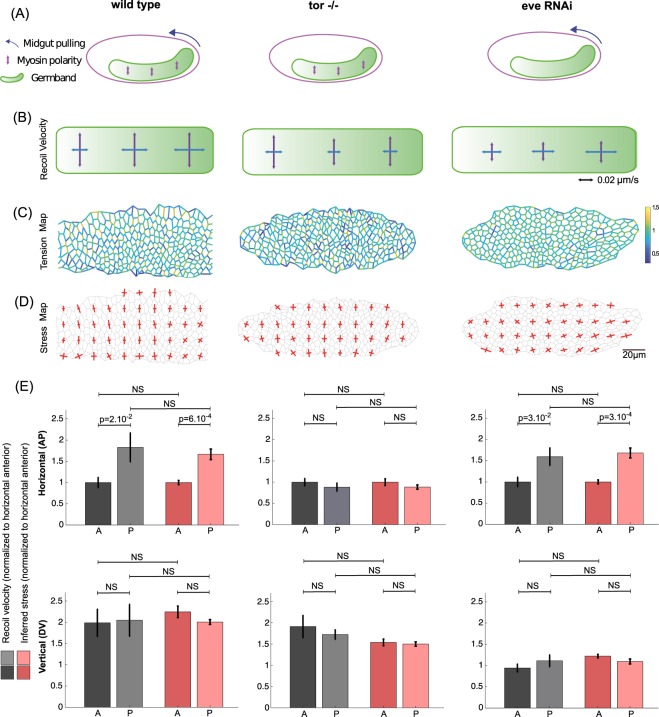
Figure 4.
Tissue scale force inference in the Drosophila germband. (A) Scheme of stress sources in the germband. In the WT condition (left), Myo-II polarity generates stress along the DV axis, and posterior midgut invagination pulls on the germband from its posterior side. In the Tor−/− condition (middle), posterior midgut invagination is abolished, and Myo-II polarity is preserved. In the Eve RNAi condition (right), posterior midgut invagination is preserved, and Myo-II polarity is abolished. (B) Recoil velocities measured with PIV for each condition in the anterior, middle and posterior regions of the germband. Vertical arrows correspond to opening velocities along the DV axis (cuts along the AP axis), and horizontal arrows correspond to opening velocities along the AP axis (cuts along the DV axis). Each arrow results from an average over N = 7 to N = 34 experiments. (C) Map of inferred tension, in a representative germband for each condition. (D) Map of inferred stress. Red crosses show the principal directions and amplitudes of the stress tensor. (E) Bar plots of normalized recoil velocity and inferred stress in the horizontal direction (top row) and in the vertical direction (bottom row) for each condition. A stands for anterior, P for posterior. Anterior (resp. posterior) inferred stress is computed as an average over the three most anterior (resp. posterior) columns of (D).

