Figure 5.

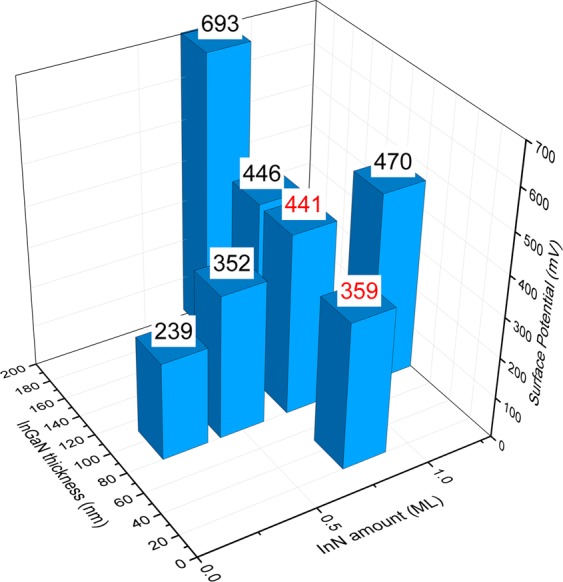
Correlation with surface potential. Diagram of the relative surface potentials measured by KPFM of the electrodes as a function of the InN deposition amount and InGaN layer thickness. Labeled in red are the best reference electrodes.

Correlation with surface potential. Diagram of the relative surface potentials measured by KPFM of the electrodes as a function of the InN deposition amount and InGaN layer thickness. Labeled in red are the best reference electrodes.