Fig. 1.
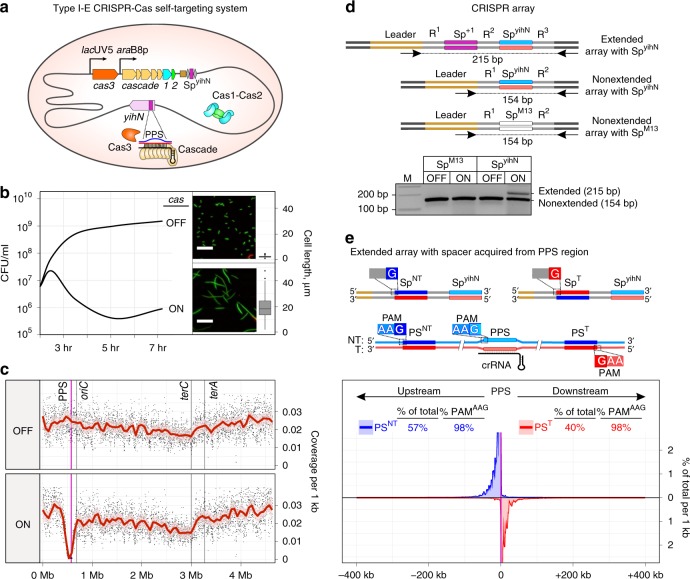
Interference-driven DNA degradation coupled with spacer acquisition in a type I-E self-targeting system. a Type I-E self-targeting system. Shaded oval, E. coli cell; gray line, chromosome; orange, tan, blue, and green pentagons, cas genes; brown rectangle, CRISPR-array leader sequence; gray diamonds, repeats; purple rectangle, spacer targeting yihN (SpyihN); lacUV5 and araB8p, promoters; mauve pentagon, yihN; PPS, priming protospacer within yihN; blue line, nontarget strand; red line, target strand; black line, crRNA. b Effect of self-targeting on cell growth. Growth curve for cultures in which cas gene expression is induced (ON) or not induced (OFF). Green, viable cells; red, non-viable cells; scale bar, 20 μm. Boxplot: the central line, median; hinges, the first and third quartiles; whiskers, 1.5 × IQR; n = 125. c Effect of self-targeting on genomic DNA content. oriC, site of replication origin; terA and terC, sites of replication termination; dot, coverage per 1 kb; red line, Loess smoothing; pink shading, 99% confidence interval. d Effect of self-targeting on spacer acquisition: PCR. Schematics depict an extended array containing SpyihN and acquired spacer Sp+1, a nonextended array containing SpyihN, or an array containing a spacer targeting M13 phage (SpM13). Blue line, non-transcribed strand of SpyihN; red line, transcribed strand of SpyihN (directs synthesis of crRNA); R, repeats. Arrows below arrays represent the positions of primers used in PCR; sizes of PCR amplicons are indicated. Results show PCR analysis of cells containing an array with SpyihN or SpM13. M, double-stranded DNA marker. e Effect of self-targeting on spacer acquisition: high-throughput sequencing analysis. Top, extended arrays with spacers acquired from PPS-region protospacers. Bottom, results. SpNT, spacer with non-transcribed strand derived from nontarget strand (NT, blue) and transcribed strand derived from target strand (T, red); SpT, spacer with non-transcribed strand derived from target strand (T, red) and transcribed strand derived from nontarget strand (NT, blue). PSNT, protospacer for SpNT; PST, protospacer for SpT. Plot shows percentage of spacers per 1 kb derived from PSNT (blue) or PST (red). Mean of three biological replicates is shown. Source data are provided as a Source Data file

