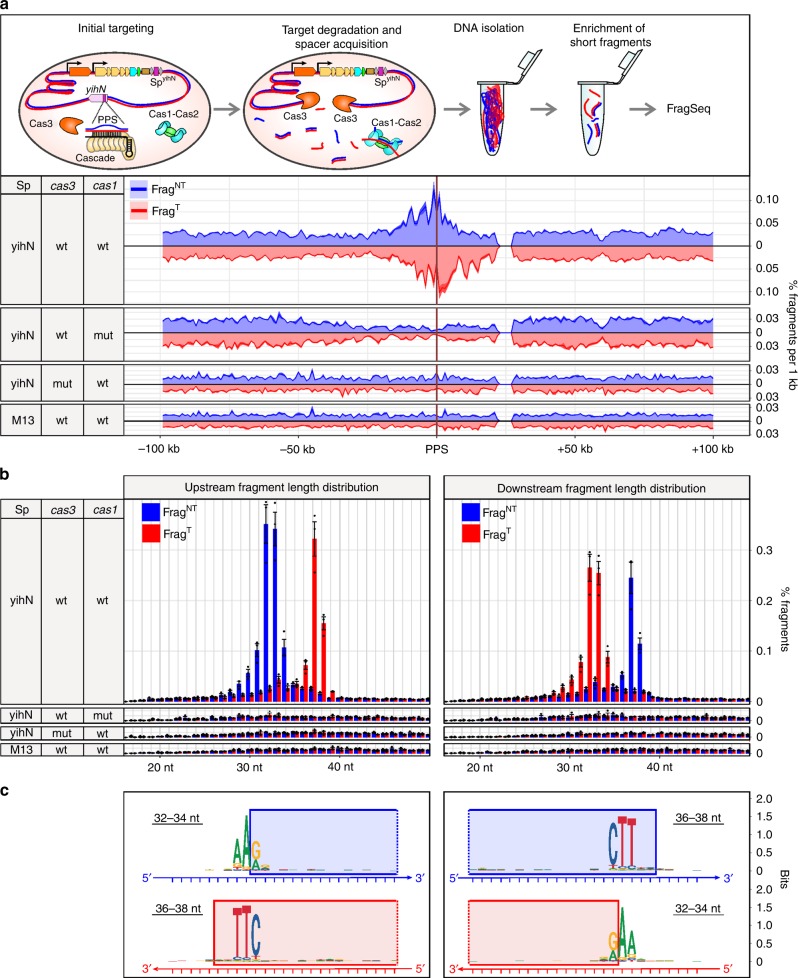
Fig. 2.
FragSeq detection of DNA fragments in cells with the type I-E self-targeting system. a Effect of self-targeting on PPS-region DNA fragment distributions. Top, events occurring in cells upon induction of cas gene expression. Bottom, FragSeq results. Coverage plots show mean of three biological replicates. Blue, nontarget-strand-derived fragments (FragNT); red, target-strand-derived fragments (FragT). b Length distributions of PPS-region-derived fragments (mean ± SEM of three biological replicates). c Sequence alignments of genomic DNA from which PPS-region fragments are derived. Blue rectangles, sequences present in FragNT; red rectangles, sequences present in FragT. Source data are provided as a Source Data file

