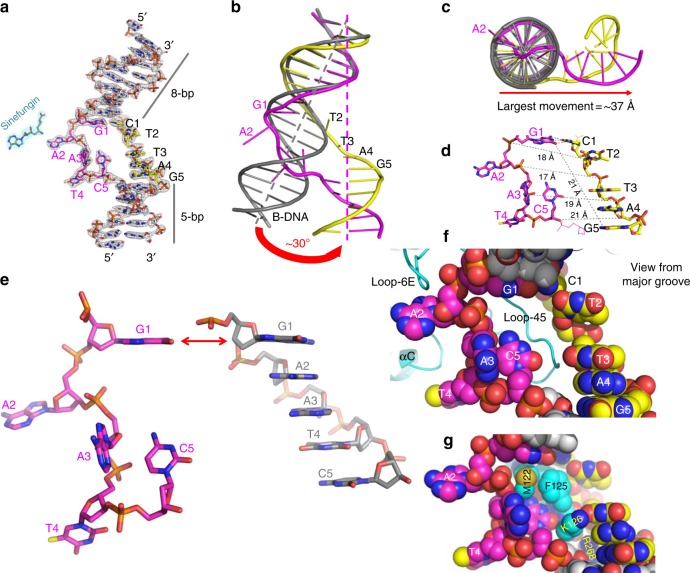
Fig. 2.
CcrM-bound DNA conformation. a Electron density 2Fo-Fc, contoured at 2σ above the mean, is shown for the entire DNA and sinefungin (see Supplementary Fig. 2b). b, c Superimposition of B-DNA (gray) and CcrM-bound DNA molecule (colored). d Increased inter-strand phosphate-to-phosphate distance and increased base step distance between two guanines G1 and G5. e Structural comparison of the target sequence in CcrM-bound form (left) and B-DNA form (right) by superimposing G1 nucleotide. f, g View from DNA major groove, with residues of Loop-45 (f) from the minor groove in a space filling model (g)

