
Fig. 2.
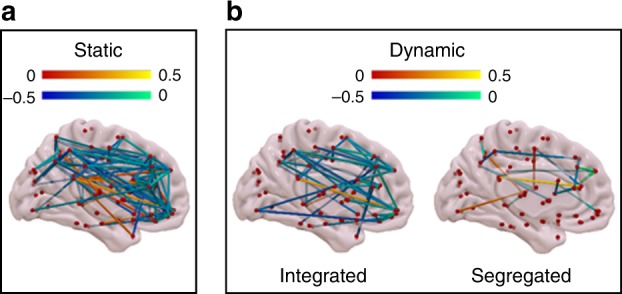
Common differences in functional connectivity (r values) when considering both awake volunteers > anaesthetized (repeated-measures t-test, FDR-corrected), and awake volunteers > DOC patients (two-samples t-test, FDR-corrected). a Differences from static FC (computed over the entire scanning length). b Differences from dynamic FC, observed only in the integrated state (left) or only in the segregated state (right). Hot colours indicate conscious > unconscious, and cold indicate unconscious > conscious (increased correlation, or decreased anticorrelation). Source data are provided as a Source Data file