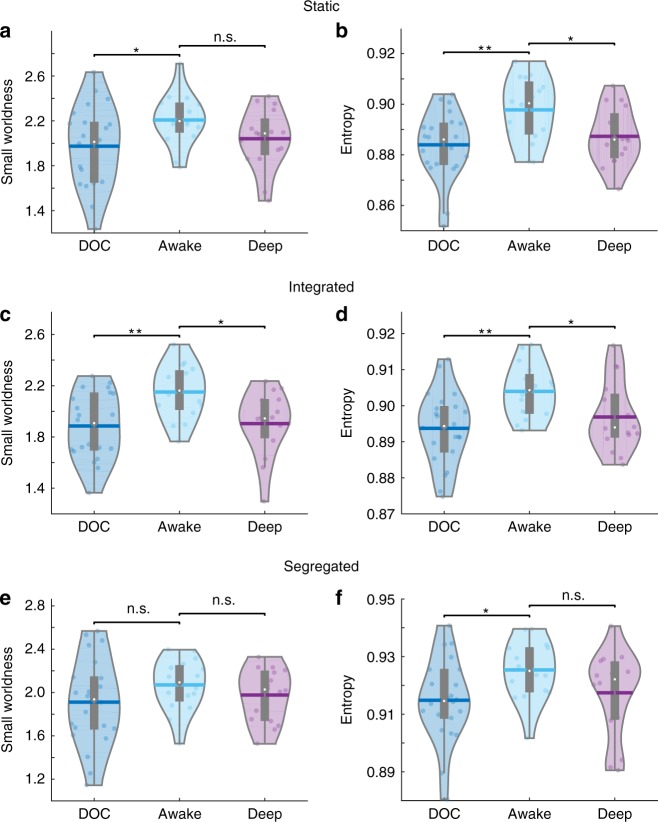
Fig. 3.
Violin plots of the mean connectivity entropy (left) and small-world values (right) for the static (a, b), integrated (c, d) and segregated (e, f) states, comparing conscious healthy controls and unconscious individuals due to anaesthesia (repeated_measures t-tests) and brain injury (two-samples t-tests). The small-world index was calculated as the ratio of normalised clustering coefficient to normalised characteristic path length. n.s. not significant; *p < 0.05; **p < 0.01; white circle, mean; centre line, median; box limits, upper and lower quartiles; whiskers, 1.5× interquartile range. Source data are provided as a Source Data file

