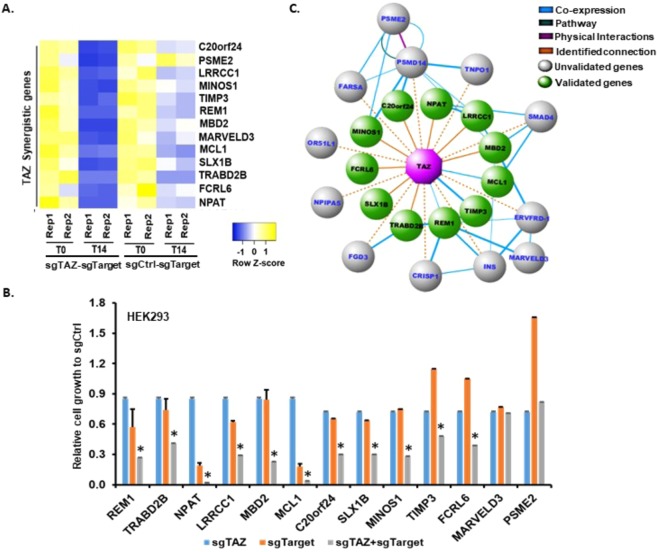
Figure 3.
Efficacy analysis of High-throughput TAZ-genome genetic interaction screen. (A) Heatmap showing expressions of selected synergistic genes interacting with Control (Ctrl) or TAZ in both T0 and T14 replicated samples (Rep1, Rep2). (B) Validation of selected synergistic genes with cell proliferation assay. Selected genes were targeted by relative sgTargets with single CRISPR-Cas9 system in HEK293-sgTAZ or HEK293-sgCtrl cell lines. Cells were plated in triplicate into 24-well plates. The next day (T0) and 14 days (T14) post plating, cells were harvested and cell numbers were counted by Flow Cytometry. The relative fold change between T14 and T0 of each cell line to that of sgCtrl cell line was calculated and presented as mean ± SD (n = 3). “*” represents the differences between cell lines containing sgTAZ + sgTarget and those of either individual sgTAZ or sgTarget were significant with P < 0.05. Validation of non-TAZ interactive genes is presented in Fig. S3A. (C) Genetic network of genes interacting with TAZ. Top 23 genes with synergistic interaction with TAZ negatively regulating cell growth from the screen were used to generate an interaction network using GeneMania. The final network reflecting 11 validated interactions (green nodes) with TAZ (purple node) were constructed in Cytoscape.

