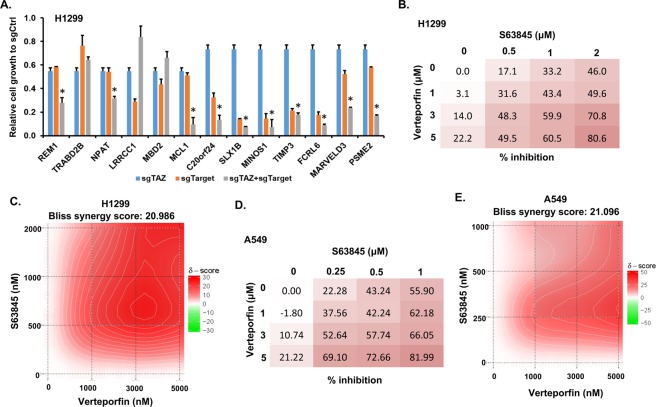
Figure 4.
MCL1 and TAZ are potential combinational drug targets for NSCLC treatment. (A) Validation of selected synergistic genes with cell proliferation assay in H1299 cells. The relative fold change between T14 and T0 of each cell line to that of sgCtrl cell line was calculated and presented as mean ± SD (n = 3). “*” represents the differences between cells expressing sgTAZ + sgTarget and those expressing individual sgTAZ or sgTarget were significant with P < 0.05. See also Fig. S3B for validation of non-TAZ interactive genes. (B) Validation of MCL1 and TAZ interaction in H1299 cells with inhibitors. H1299 cells were treated with MCL1 inhibitor S63845 alone or together with Verteporfin to target TAZ at relative concentrations mentioned in the figure for 3 days. Then cell viability was measured through CellTiter-Glo (Promega), the rate of inhibition or viability was further calculated based on the measured values of control (DMSO) and those treated with drugs. (C) A 2D plot of Bliss synergy score was generated with SynergyFinder showing that the two inhibitors used in (B) has synergistic effect. (D) Validation of MCL1 and TAZ interaction in A549 cells with inhibitors. The treatment was similar as described in (B). E. Bliss synergy score of treatment performed in (D).

