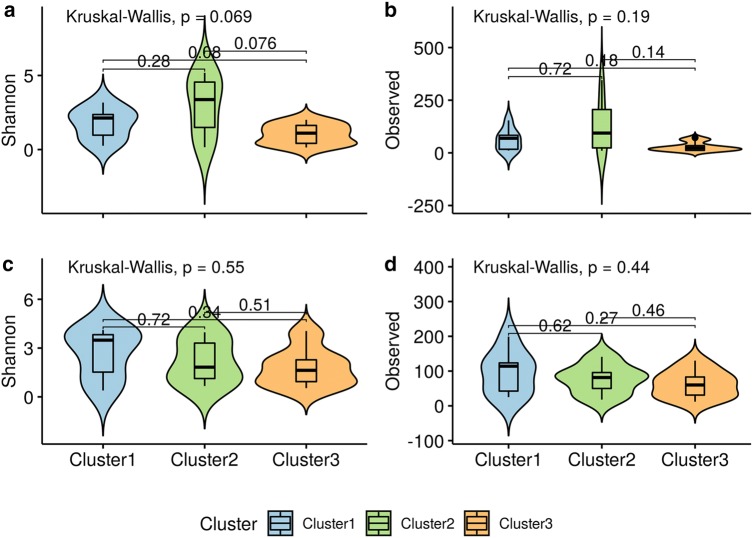
Fig. 1.
Violin plot representing alpha diversity measurements. a Shannon Diversity Index and b observed OTUs of maternal vaginal samples. c Shannon Diversity Index and d observed OTUs of newborns’ meconium samples. Colors indicate cluster classification, babies samples are colored according to mother’s cluster. Observed stands for the number of OTUs found in each cluster and Shannon stands for Shannon Diversity Index. Boxes span the first to third quartiles; the horizontal line inside the boxes represents the median black dots represents all samples in each group and red dots represent outliers

