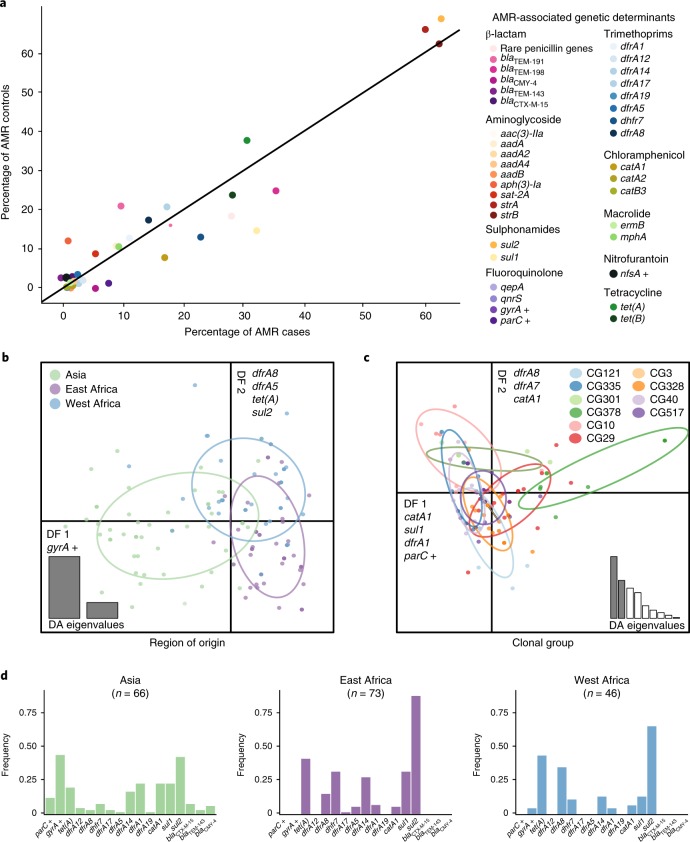
Fig. 3. AMR gene content is explained by region of isolation, not disease status or clonal group.
a, Frequencies of AMR-associated genes in aEPEC by case or control status. Genes encoding AMR are shown to the right of the graph and are grouped by drug class. b,c, Discriminant analysis of principal components based on known genetic determinants of AMR. The graphs display the discriminant functions (DF) that best discriminate isolates into region of isolation (b, n = 185) or clonal group (c, n = 137). Data points are coloured coded according to their demographic group (see legend) and the genetic determinants most correlated with the DFs are labelled on the DF axes. Eigenvalues, corresponding to the ratio of the variance between groups over the variance within groups for each principal component in the discriminant function, are displayed in the insets. d, Frequency of AMR genetic determinants that differed between Asia, East Africa and West Africa. Genes that contain point mutations that result in AMR and that are not acquired through horizontal gene transfer are indicated with a cross.

