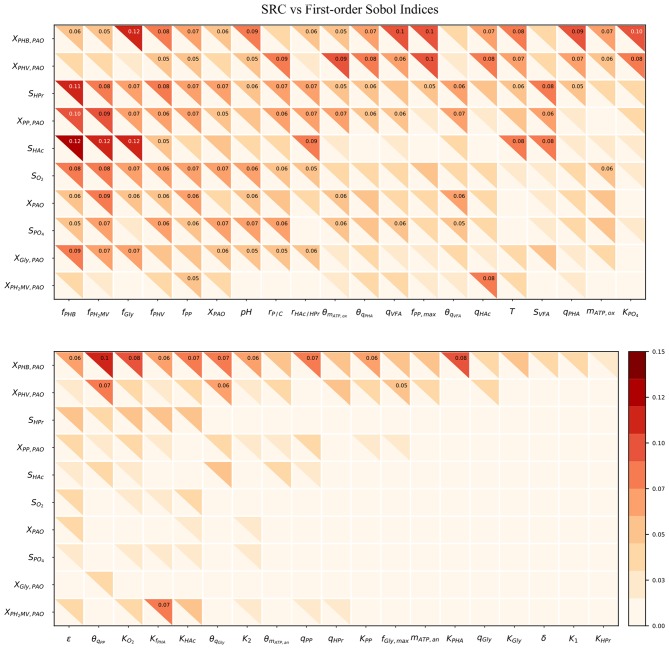
Figure 4.
Heatmap of the SRC and first-order Sobol indices for PAO-related input parameters. Rows indicate output variables, whereas columns indicate input parameters. SRC values are located in the lower-left triangle. The first-order Sobol index is in the upper-right triangle. The cut-off value to display the sensitivity index was 0.05.

