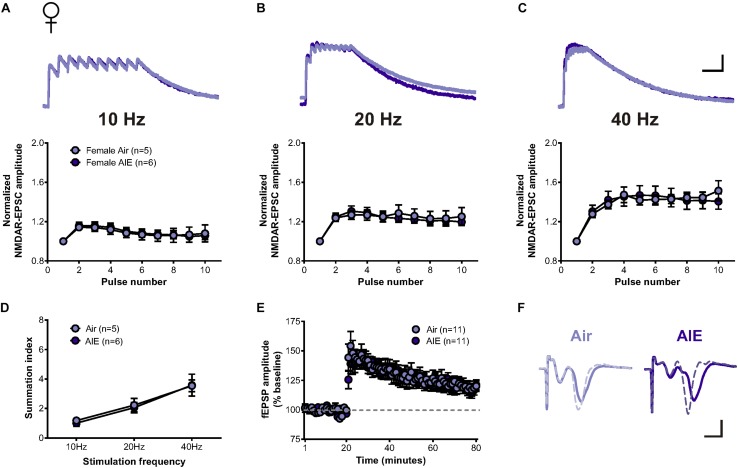
FIGURE 4.
Temporal summation of NMDAR-EPSCs and LTP following acute withdrawal from AIE in the female dlBNST. (A–C) Representative traces (top; Air light purple, AIE dark purple) and pooled data (bottom) demonstrating the lack of difference between female groups in response to 10 stimulation pulses given at 10, 20, and 40 Hz to induce temporal summation of NMDAR-EPSCs; vertical scale bar = 200 pA, horizontal scale bar = 200 ms. (D) Plot of the summation index across stimulation frequencies and treatments demonstrating no significant difference in temporal summation following AIE in females. (E) Time course showing no difference in synaptic field potentials at baseline (20 min) and after the induction of LTP by high-frequency stimulation (two 1-s trains at 100 Hz) in the dlBNST of mice from Air- and AIE groups. (F) Representative traces recorded from Air (light purple) and AIE (dark purple) female mice before (solid) and 60 min after (dashed) the high frequency tetanus; vertical scale bar = 0.3 mV, horizontal scale bar = 2 ms. All data points represent the mean ± SEM.

