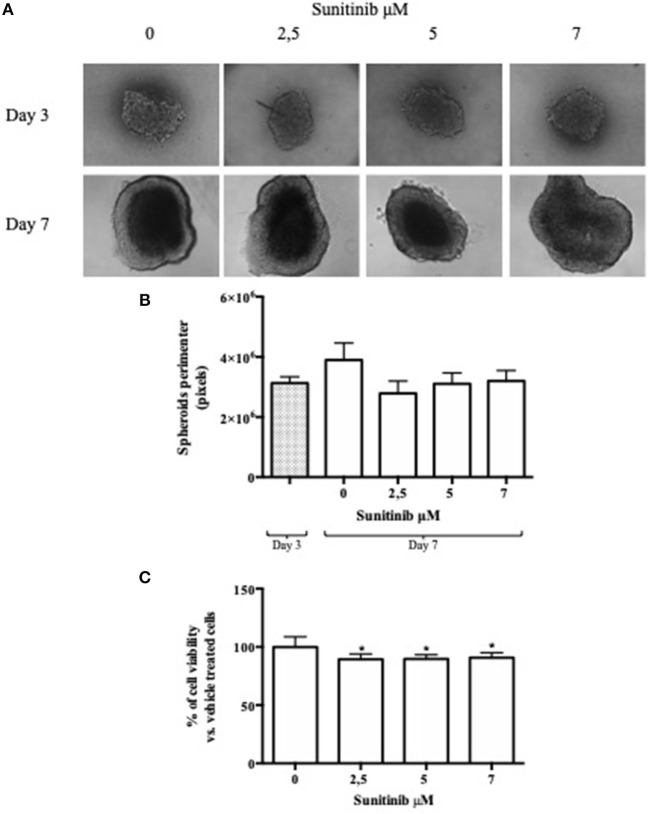
Figure 1.
Hanging drop method. BON1 cells were seeded into a 96 well hanging drop plate and treatments with Sunitinib were performed after spheroids transfer in a regular 96 well plate. (A) In the upper lane (Day 3) pictures were taken at day 3 after seeding inside the 96 hanging drop plate with EVOS FL Cell imaging System (10 × objective); in the lower lane (Day 7) spheroids pictures were taken at day 7 after transfer in a regular 96 well plate. Spheroids were treated at day 3, after transfer from the first to the second plate, with Sunitinib 2.5, 5, and 7 μM. (B) Perimeter analysis of spheroids was performed at day 3 and 7 and represented in a graph. Gray column: perimeter analysis at Day 3, before treatments. White columns: perimeter analysis at Day 7 under indicated treatments. The analysis was performed using Image J software and measurements were performed from three independent experiments in two replicates. (C) Cell viability was measured as absorbance in three independent experiments with six replicates each, and it is expressed as the mean ± S.E.M. *P < 0.05 vs. vehicle cells.

