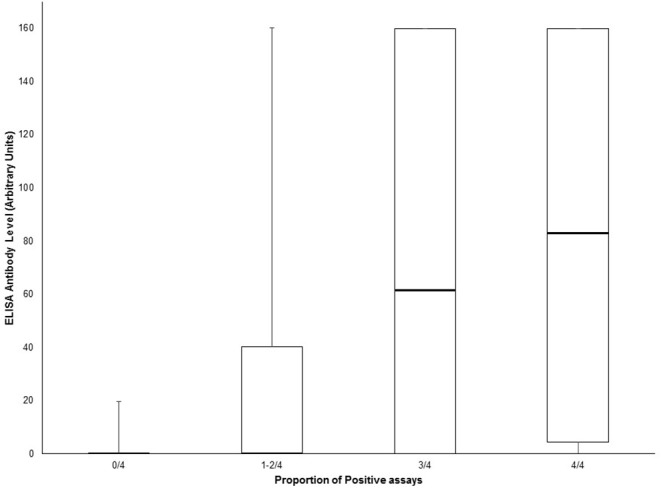
Figure 3.

Box and whisker plot of ELISA antibody levels according to the proportion of positive AQP4 assays (tissue-based indirect immunofluorescence, Euroimmun® M1/M23 biochip slide, Euroimmun® AQP4/MOG biochip slide and Oxford live cell-based assay). Central bar shows the median, boxes represent interquartile range, and whiskers indicate range.
