Figure 5.
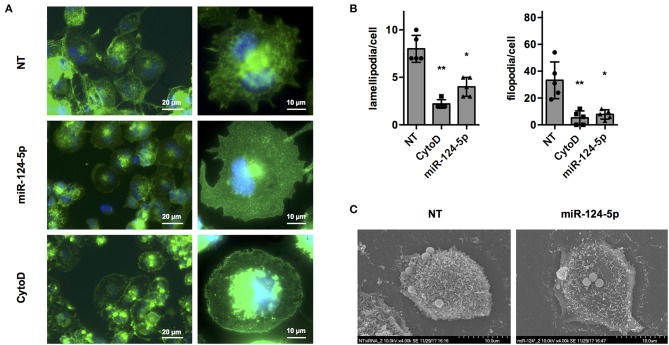
Transfection with miR-124-5p alters cell morphology of PMA-activated THP-1 MΦ. (A) Fluorescence microscopy of PMA-activated THP-1 MΦ following the indicated treatments. Actin cytoskeleton was stained with Alexa Fluor 488-phalloidin and nuclei with Hoechst 33342. Images were acquired with a Zeiss AxioObserver Z1 using a 40× (left panels; scale bars: 20 μm) or a 100× objective (right panels; scale bars: 10 μm) and overlays of the fluorescence channels for phalloidin (green) and Hoechst (blue) are shown. (B) Quantitative analysis of lamellipodia and filopodia formed by PMA-activated THP-1 MΦ following the indicated treatments. Image analysis was performed as described in Supplementary Figure S5. A total of 47–57 cells (depending on the condition) of n = 5 independent experiments were analyzed. Mean values for each experiment are indicated by symbols and the mean ± SD across experiments are indicated by a bar and whiskers. Statistical analysis was performed using repeated measures, one-way ANOVA with Geisser–Greenhouse correction. Dunnett's post analysis was used to calculate p-values adjusted for multiple comparisons with the NT set as control condition (*p < 0.05; **p < 0.01). (C) SEM of PMA-activated THP-1 MΦ following the indicated treatments. Images were acquired with a Hitachi S-5200 scanning electron microscope at 4,000 × magnification. Representative cells of n = 3 independent experiments are shown.

