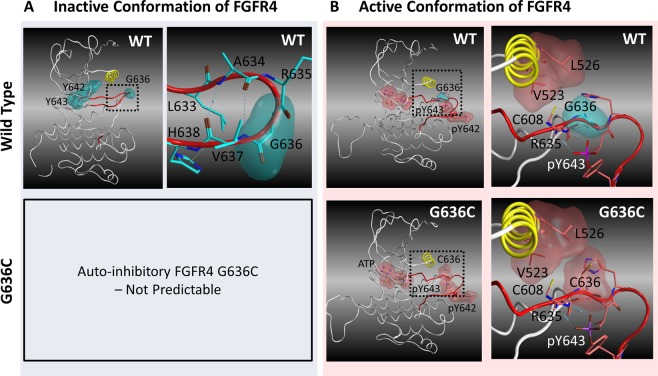
Figure 2.
Three-dimensional structural models of catalytically inactive and active FGFR4. (A) X-ray structure of the kinase domain of FGFR4 in the auto-inhibitory conformation (PDB code: 4TYE20). The αC helix and A-loop are yellow and red, respectively. Blue and yellow dotted lines represent hydrogen bonds and the CH-π bond, respectively. The upper left panel shows an overview of the kinase domain, and the upper right panel shows the amino acid resides within 4.5 angstroms from G636. (B) Predicted 3D structure of the catalytically active conformation kinase domain. The left panels show overviews of the kinase domain, and the right panels show the amino acid resides within 4.5 angstroms from G636 or C636.

