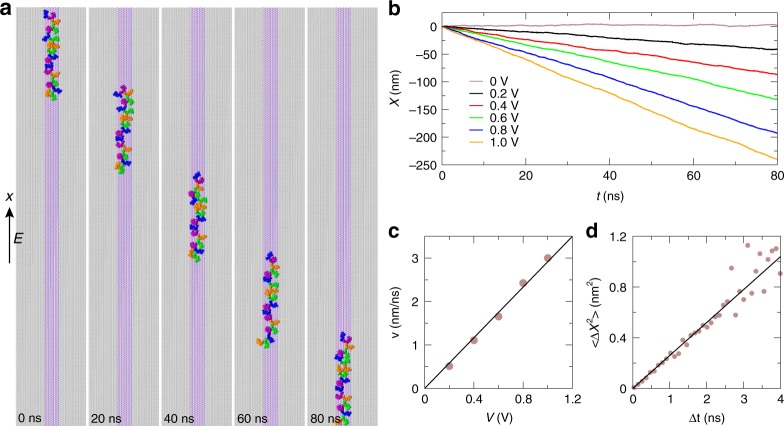
Fig. 3.
Electrophoretic transport of ssDNA on the graphene/h-BN/graphene heterostructure. a Illustration of electrically driven motion of ssDNA at different times (V = 0.2 V). The electric field is applied along the h-BN stripe. b Time-dependent displacements of ssDNA in various external biasing voltages. c Mean velocities of ssDNA at various applied biasing voltages. d Mean-square-displacements of ssDNA at different time intervals, when V = 0 V

