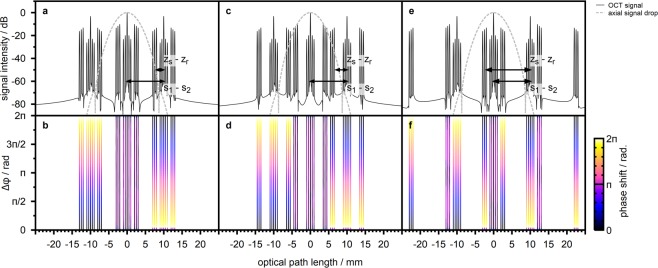
Figure 2.
Semi-analytic calculation of the expected SD-OCT signal for a sample of three reflective layers and an arm length detuning at the source interferometer. (a) OCT-signal in case the reference and sample arm lengths and approximately match. The effect of finite spectral resolution is neglegted. The dashed line indicates the axial signal drop due to the finite resolution of the spectrograph which is modelled by the product of a Gaussian and a sinc function. (b) Phase of the A-scan signal in case the phase difference at the source interferometer is changed. The data is thresholded to signal components with amplitude larger than −60 dB. (c and d) A-scan amplitude and phase in case the reference arm length is shortened by 1.5 mm. (e and f) A-scan amplitude and phase in case the reference arm is shortened by 10 mm, matching the arm length detuning Δs at the source interferometer.

