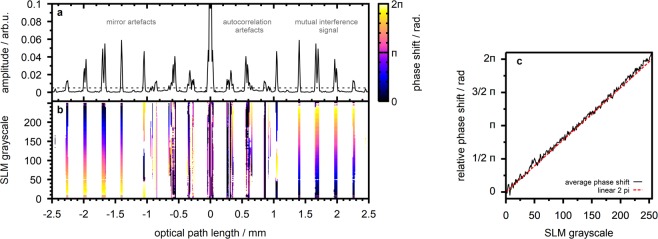
Figure 3.
SLM-based phase shifting. (a) Observed OCT signal amplitude for a flat sample with four reflecting interfaces. (b) Observed OCT signal phase in case of wavefront manipulation at the bottom half of the SLM screen (reference arm). The phase is illustrated for those positions where the signal amplitude is larger than 0.5% of the DC peak amplitude. (c) Average phase shift at the mutual interference signal components, i.e. above the amplitude threshold and between and .

