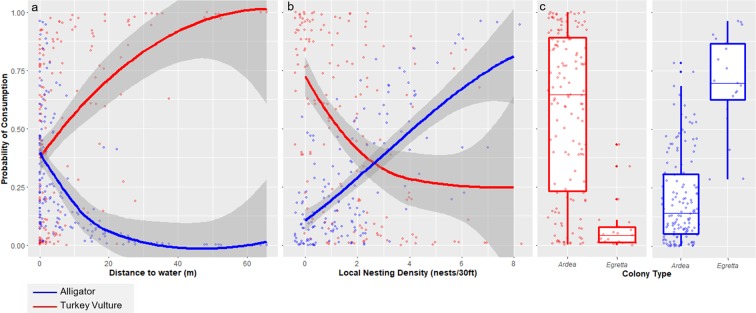
Figure 1.
Modeled probabilities of bait consumption by alligators and vultures in relation to main covariates: (a) distance to water (meters), (b) nesting density (number of nests/30 ft), and (c) colony type (Ardea or Egretta) for alligators and Turkey Vultures. Blue lines represent the trends for alligators and red lines represent the trends for Turkey Vultures. Lines show a smoother fitted to predicted individual values (indicated by points) from best generalized linear mixed effects model output for alligator and vulture models. Shaded areas indicate standard error of the smoother. In boxplots, central line shows the median, boxes include all values within the 0.25 and 0.75 quantiles and whiskers indicate range excluding outliers.

