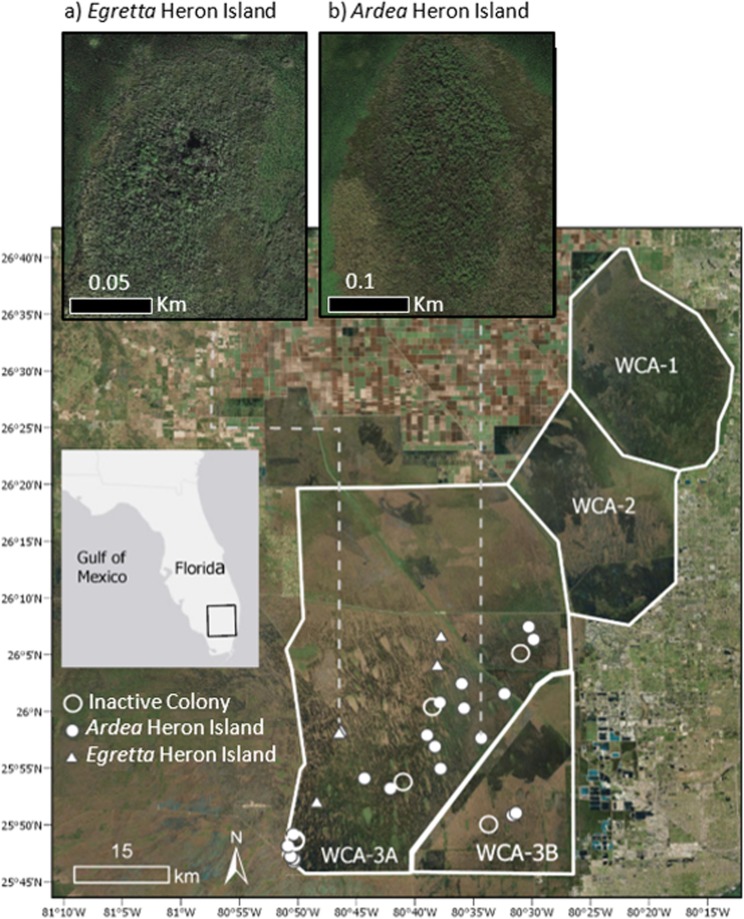
Figure 3.
Map of the study area with locations for all wading bird nesting colonies sampled. Solid white circles represent Ardea heron islands, solid white triangles represent Egretta heron islands, and empty white circles represent inactive islands. Inset maps show the difference in size (note scale) and shape typical of (a) Egretta and (b) Ardea heron islands. Map generated in ESRI ArcMap 10.6.177 (http://www.esri.com/). Main map satellite imagery is the World Imagery basemap within ArcGIS 10.6 software (http://www.esri.com/data/basemaps), credited to Esri, DigitalGlobe, Earthstar Geographics, CNES/Airbus DS, GeoEye, USDA FSA, USGS, Aerogrid, IGN, IGP, and the GIS User Community. Gray inset extent map imagery is the Light Gray Canvas basemap within ArcGIS 10.6 software (http://www.esri.com/data/basemaps), credited to Esri, HERE, Garmin, FAO, NOAA, USGS, © OpenStreetMap contributors, and the GIS User Community. Inset satellite imagery (a,b) image data © Google 2019: Google Earth (Map data: Google) (https://www.google.com/earth/).

