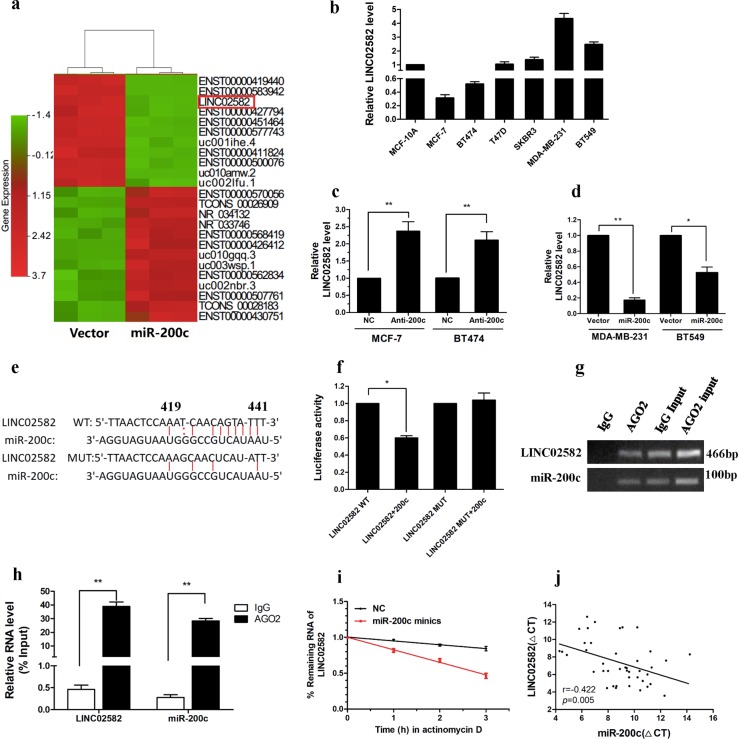
Fig. 2. LINC02582 is a target of miR-200c.
a Representative heat map of the lncRNAs that were most differentially expressed between miR-200c-overexpressing cells and control cells. b Relative expression of LINC02582 in breast cancer cells and MCF-10A cells. c Relative expression of LINC02582 in MCF-7 and BT474 cells after transfection with the miR-200c inhibitor. d Relative expression of LINC02582 in MDA-MB-231 and BT549 cells after transduction with miR-200c. e Target site of miR-200c in the LINC02582 sequence, as predicted by TargetScan and miRBase (upper panel). f Relative luciferase activity of MDA-MB-231 cells after co-transfection with wild type or mutant LINC02582 vectors and an miR-200c mimic. g Anti-AGO2 RIP to investigated AGO2 binding to miR-200c and LINC02582; IgG was used as a negative control. h The levels of miR-200c and LINC02582 were detected by qRT-PCR and presented as fold enrichment of AGO2 relative to input. i The half-life of LINC02582 was shortened by miR-200c overexpression. MDA-MB-231 cells were transfected with miR-200c mimics, after 48 h, a time course for RNA stability was started by adding the actinomycin D. The cells were harvested at the indicated time points. The expression levels of LINC02582 were detected by qRT-PCR. j Expression levels of LINC02582 and miR-200c were negatively correlated in 42 breast cancer samples, as measured by qRT-PCR. The ΔCT values were subjected to Pearson correlation analysis. Data are presented as means ± SD, n = 3, *P < 0.05, **P < 0.01

