Figure 3.
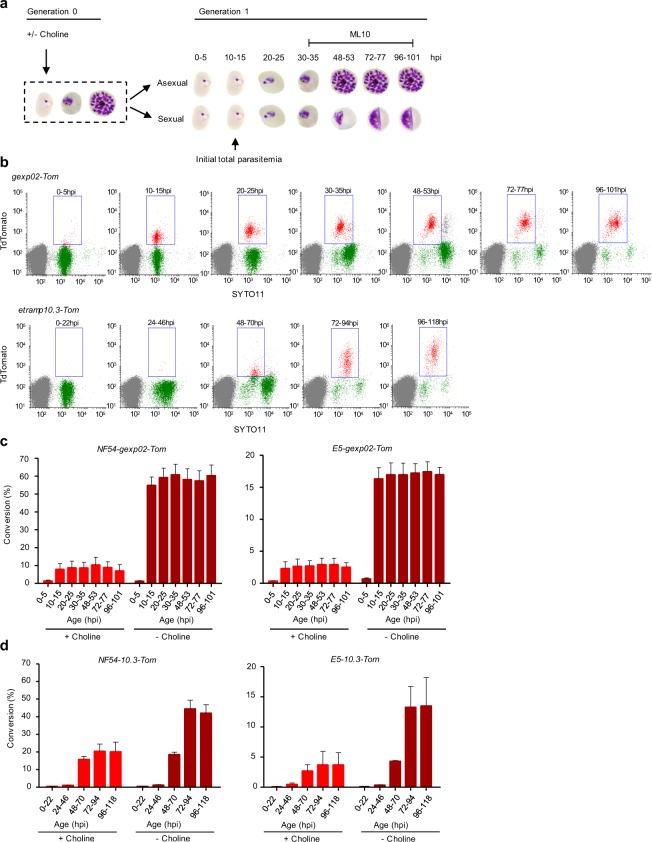
Flow cytometry-based time-course analysis of gexp02-tdTom and etramp10.3-tdTom expression during sexual development. (a) Schematic overview of the experiment design. Cultures were either maintained in the presence of choline, or with choline removed at the ring stage to induce sexual conversion. After reinvasion, the proportion of tdTom-positive parasites was determined by flow cytometry at several times (the times shown correspond to experiments with the gexp02-Tom lines, which were synchronized to a 5 h age window). ML10 was added at the trophozoite stage (generation 1, as indicated) to prevent schizont rupture and reinvasion. (b) Representative flow cytometry SYTO11 (stains DNA) – tdTomato plots for the NF54-gexp02-Tom and NF54-etramp10.3-Tom transgenic lines (- choline condition) at different times after invasion. Gates (rectangles) indicate SYTO11 and tdTomato double-positive parasites. (c) Quantification of sexual conversion rates at different times in the NF54-gexp02-Tom and E5-gexp02-Tom lines, based on detection of tdTomato fluorescence. Conversion rates (%) were determined as the gametocytemia relative to the initial rings parasitemia. Data are presented as the average and s.e.m. of three independent biological replicates. (d) Same as panel c, but for the NF54-etramp10.3-Tom and E5-etramp10.3-Tom lines. Data are presented as the average and s.e.m. of two independent biological replicates.

