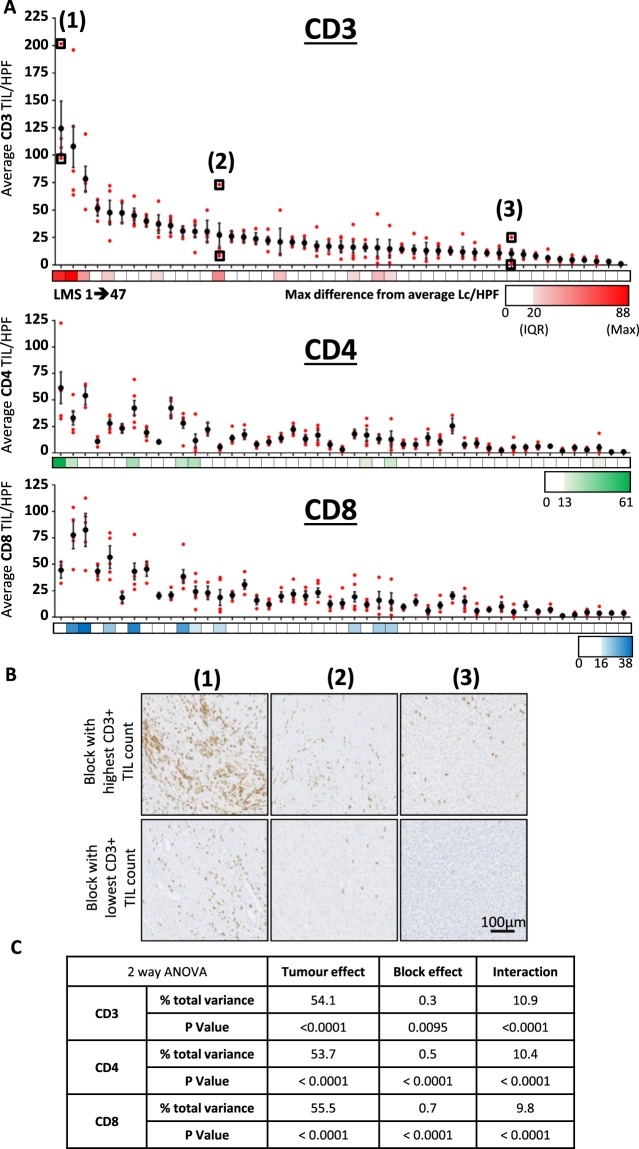
Figure 2.
Assessment of inter- and intra-tumour heterogeneity of TIL burden in LMS. (A) Dot plot shows average CD3+, CD4+ and CD8+ TIL/HPF values for each of 47 LMS tumours (vertically aligned), with overall tumour value (+/−95% confidence interval) and individual constituent blocks values shown with in black and red respectively. Colour bars demonstrate maximum difference of any related tumour block from overall tumour average, with zero, cohort interquartile range (IQR), and maximum difference values shown on colour key for each lymphocyte marker. (B) Representative IHC images at x20 magnification demonstrate CD3+ TIL burden between the most and least densely infiltrated blocks from three tumours as indicated in (A). (C) Table summarising results from three separate 2-way ANOVA analyses that identifies the contribution of intra-tumour (block effect) and inter-tumour (tumour effect) variance to the overall total amount of variance in lymphocyte counts for CD3, CD4 and CD8 within the 47 LMS cohort.

