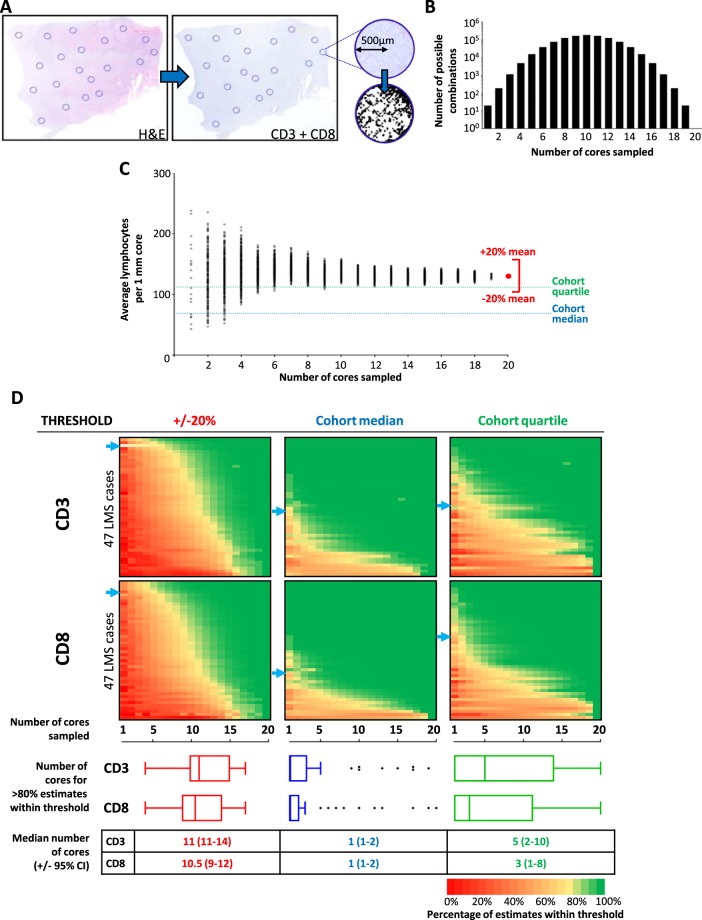
Figure 3.
Optimal number of TMA cores relates to required degree of accuracy for assessment of lymphocyte infiltration. (A) Overview diagram of process for selection of virtual TMA cores and T lymphocyte counting. For each of 47 LMS, a digital H&E slide from a representative block was marked for 20 × 1 mm diameter areas, encompassing spatial and any morphological heterogeneity with section. Selected core areas were mapped on to corresponding CD3 and CD8-stained sections. Core areas were isolated as individual digital images. Number of IHC-positive lymphocytes in each core area was digitally counted. (B) Bar chart showing number of possible combination of cores when between 2–20 cores are assessed. Average lymphocyte count per core (TIL/core) was calculated for all possible combinations for each tumour. (C) Dot plot showing all possible average lymphocyte counts (number indicated in (B) for a single exemplar tumour when 1–20 cores are selected. Average of all 20 cores (red dot) taken to be represent overall TIL burden for that tumour. For each tumour, the number of cores that needed to be sampled in order for >80% calculated averages to fall within either (i) +/−20% of ‘true TIL burden’ for corresponding tumour, (ii) correct side of cohort median TIL value (CD3 median = 69 TIL/core; CD8 median = 59 TIL/core), or (iii) within correct cohort quartile (CD3 IQR = 18–110 TIL/core; CD8 IQR = 19–121 TIL/core). In this illustrated exemplar case, overall CD3+ TIL burden is above 3rd quartile (Q75 = 110). (D) Colour plots indicating percentage of systematically calculated average lymphocyte counts from all possible combinations of between 1–20 cores to fall within stated threshold (+/−20%, cohort median or cohort quartile). Blue arrows indicate exemplar case shown in C. Tukey box and tail plots indicate cohort distribution of number of cores required for >80% of estimates to fall within stated threshold. Table summarises cohort median number of cores required >80% of estimates to fall within stated threshold (+/− approx. 95% confidence interval).

