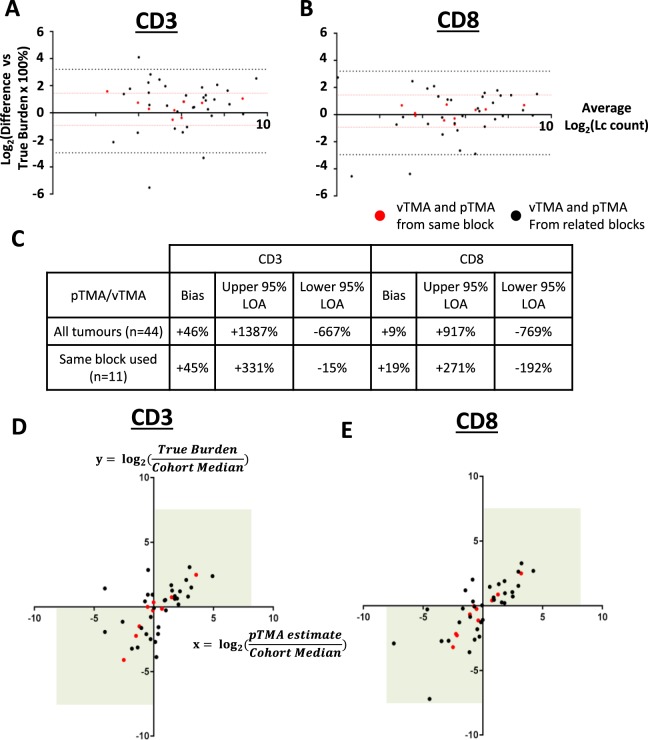
Figure 4.
Triplicate TMA cores can identify tumours as having a high or low TIL burden, but do not accurately estimate precise TIL numbers. Bland Altman plots show percentage difference of pTMA-derived estimated TIL burdens compared to true TIL burdens for (A) CD3 and (B) CD8. 95% limits of agreement (LOA) for all 44 tumours shown by black dotted lines, 95% LOA for 11 tumours with pTMA and vTMA from same block shown by red dotted lines. LOA and biases from these plots are summarised in (C). Dot plots show ratio of pTMA-derived estimated TIL burden:cohort median value (x axis) plotted against ratio of true TIL burden:cohort median value (y axis) for (D) CD3+ and (E) CD8+ TILs. Ratio >0 indicates tumour identified as ‘High TIL burden’ (i.e above cohort median). Ratio <0 indicated tumour identified as ‘Low TIL burden’. Values in top right or bottom left quadrant (green boxes) indicate consistent TIL categorisation based on pTMA-derived estimate and true TIL burden. Red dots represent tumours where pTMA and vTMA sampled from same tumour block, black dots represent tumours where pTMA and vTMA were sampled from different blocks from same tumour specimen.

