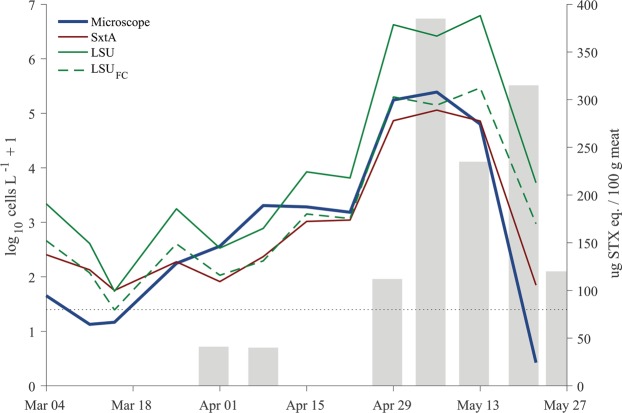
Figure 3.
Mean of cell concentration estimates from samples collected at 5 m by survey day through the full course of the 2013 A. catenella bloom in Salt Pond. LSUFC data are revised estimates of cell concentration based on comparison to microscopy counts as described in the text. Gray bars indicate PST levels measured by mouse bioassay in Mytelis edulis collected from Salt Pond by the Massachusetts Department of Marine Fisheries (limit of detection: 40 µg STX eq./100 g shellfish meat). Linear correlations between PST levels and cell concentrations from 7 days previously as measured by microscopy and sxtA (n = 8) were highly significant (r2 = 0.93, 0.91, respectively, p < 0.0001 for both).

