
Figure 4.
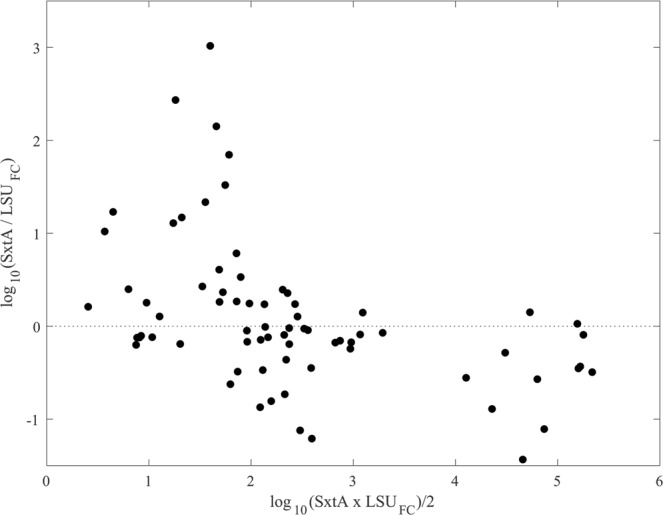
Bland Altman plot comparing log-transformed sxtA and field-calibrated LSU assay derived estimates of A. catenella abundance. Points are means from triplicate qPCR assays of a single DNA extract. The sxtA assay significantly overestimated cell concentration in samples with fewer than 200 cells, a threshold that corresponds to about 5 cell equivalents or approximately 103 sxtA copies per reaction. Were assays equivalent points would be tightly clustered about 0 across the full range of measured concentrations (x-axis).