Figure 5.
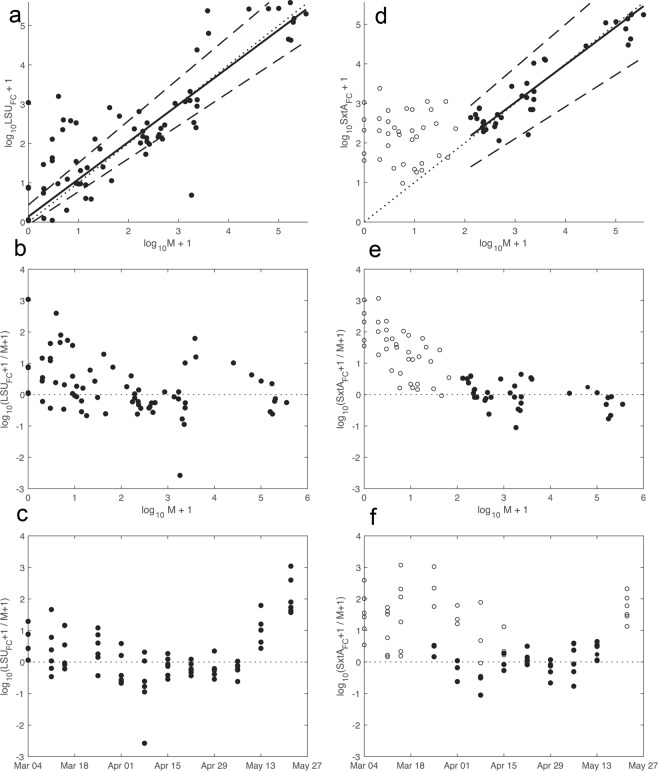
Passing Bablok regression and residual analyses. (A) Results from regression of microscopy and field-calibrated, LSU qPCR estimates of cell concentration. Solid line is the linear relationship described by parameters in Table 2, dotted line is 1:1, and dashed lines are upper and lower bounds from 95% confidence interval estimates of the regression. (B) Log-transformed residuals from the LSU-microscopy regression across the range of concentrations as estimated by microscopy. (C) The same log-transformed residuals but plotted by sampling day. The LSU assay tended to overestimate cell concentrations during early bloom development (March 4 and 11) and bloom termination (May 13 and 22). (D) Regression of microscopy and field-calibrated, sxtA qPCR estimates of cell concentration derived from the subset of samples ≥100 cells L−1 by microscopy (closed, black circles). Open circles are data points excluded from the regression (microscopy estimate <100 cells L−1). (E) Log-transformed residuals from the sxtA-microscopy regression across the range of observed cell concentrations. The sxtA assay increasingly overestimated cell concentrations in samples below the 100 cells L−1 threshold. (F) Log-tranformed residuals from sxtA-microscopy regression plotted by sampling day. Samples with cell concentrations >100 cells L−1 (closed, black circles) are more tightly clustered about 0 (no error) than samples with lower concentrations (open circles) and as estimated using the LSU assay (left column).

