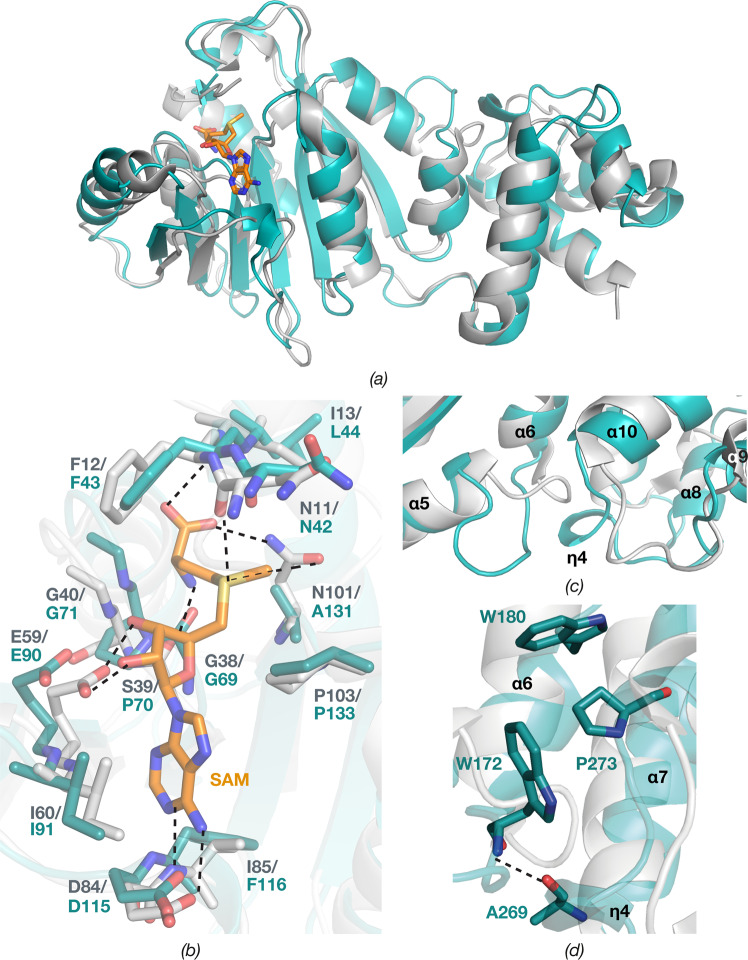
Figure 4.
Superposition of ErmC’ (grey) in complex with SAM (orange) (PDB ID 1QAO)21 onto ErmE (teal). (a) Overall structures. (b) Residues interacting with SAM at the SAM binding site. Main chain carbonyl oxygens are only shown if involved in SAM binding. Hydrogen bonds are shown by dashed lines. (c) Comparison of interdomain region including the α5-α6 and α9-α10 loops and the additional η4 in ErmE. (d) Residues involved in interdomain interactions in ErmE.

