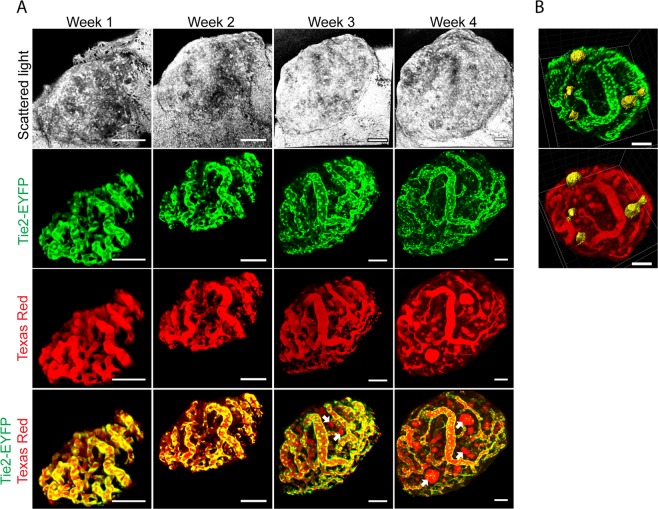
Figure 2.
High-resolution of tumour stromal cells. (A) Image panel showing a RT2 tumour following implantation into a Tie2-EYFP host at indicated time-points. Tumour cells were visualized by scattered light (grey scale). Tumour vessels were visualized by EYFP expressed by endothelial cells (and through Texas Red-70 kDa dextran administered to the circulation (Texas Red) (red). Intratumour cavities, i.e. blood islands, filled by Texas Red dye but lacking endothelial lining were observed from week 3 (arrows). Bottom row represents merged images (n = 7). (B) The 3D image projections display the localization of intratumour cavities (yellow) in relation to the tumour vasculature. Scale bars represent 50 μm.

