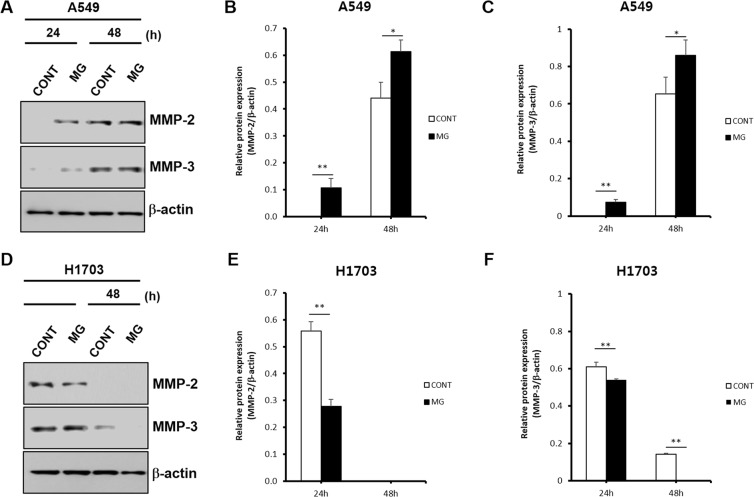
Figure 6.
Protein expression evaluation by western blotting of A549 and H1703 on CONT and MG. Comparison of MMP-2 and MMP-3 protein expression between CONT and MG in A549 cells (A). Relative MMP-2 protein expression levels of CONT and MG over time in A549 cells (B). Relative MMP-3 protein expression levels of CONT and MG over time in A549 cells (C). Comparison of MMP-2 and MMP-3 protein expression between CONT and MG in H1703 cells (D). Relative protein expression levels of CONT and MG over time in H1703 cells (E). Relative protein expression levels of CONT and MG over time in H1703 cells (F) (*p < 0.05, **p < 0.01).

