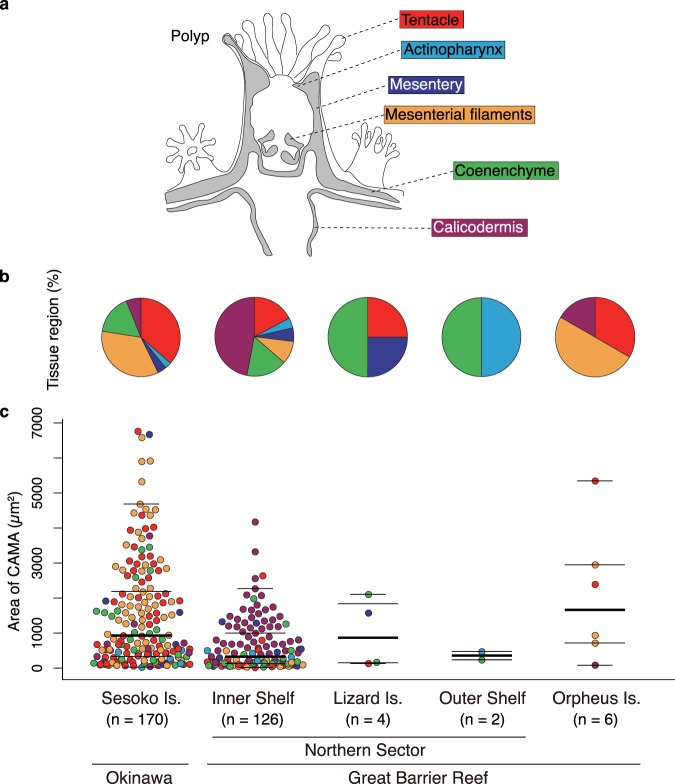
Figure 4.
Distribution of CAMAs within six anatomical regions of the coral Acropora hyacinthus collected from five sites in Japan and Australia. (a) Schematic drawing of a coral polyp showing the six anatomical regions examined microscopically (same color coding used in (b,c). (b) Pie charts showing the distribution of CAMAs among six anatomical regions in samples from the five sites. (c) Dot plots comparing the size of CAMAs among anatomical regions for each location. N = 308 CAMAs detected in tissues treated with FISH. In the dot plot, the lines indicate median (thick line), 3rd (upper) and 1st (lower) quartiles (long thin lines), whiskers (short thin lines; upper value indicates largest value within 1.5* interquartile range from 3rd quartile, lower: min value).

