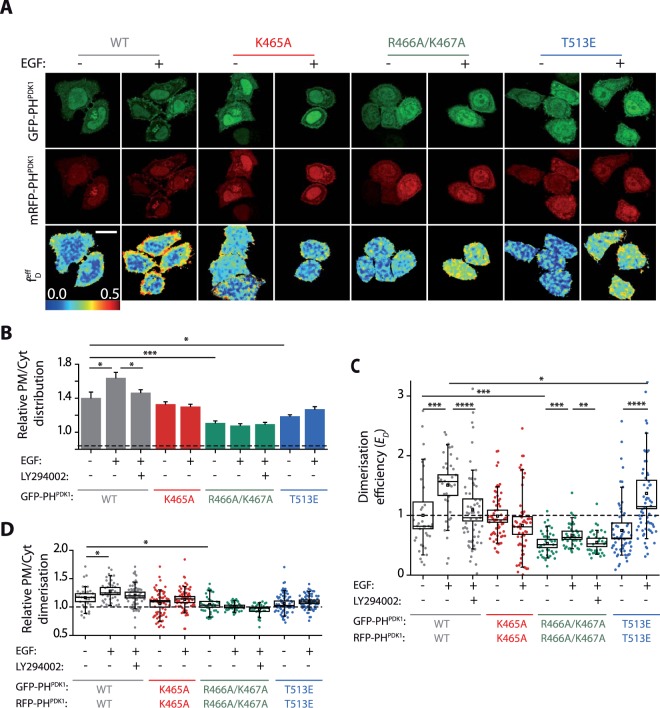
Figure 4.
The homodimerisation and localisation of PDK1 PH domain follows PtdIns(3,4,5)P3 levels, contrary to full-length PDK1. All experiments were performed under resting conditions (−), stimulation of the PI3K pathway with EGF (+) or treated with the PI3K inhibitor (LY294002) prior to stimulation. SKBR3 cells were cotransfected with GFP- and mRFP- tagged PHPDK1. (A) Representative intensity and FRET-FLIM fD images. (B) Relative distribution of PHPDK1 at the PM and the cytoplasm of SKBR3 cellx. The dashed line indicates the reference level for a control cytoplasmic protein (Table 1). (C) Quantification of the homodimerisation efficiency of WT PHPDK1 and its mutants. (D) Localisation of the PHPDK1 homodimers in SKBR3 cells. The graph shows the ratio of PHPDK1 dimers at the PM and the cytoplasm based on the segmentation of the fD images shown in (A). Scale is 20 µm. N > 30. Error bars: SEM. (C,D) N > 30. Box: 2xSEM; Whiskers: 80% population. Mann-Whitney test *p < 0.05. Three independent experiments.

