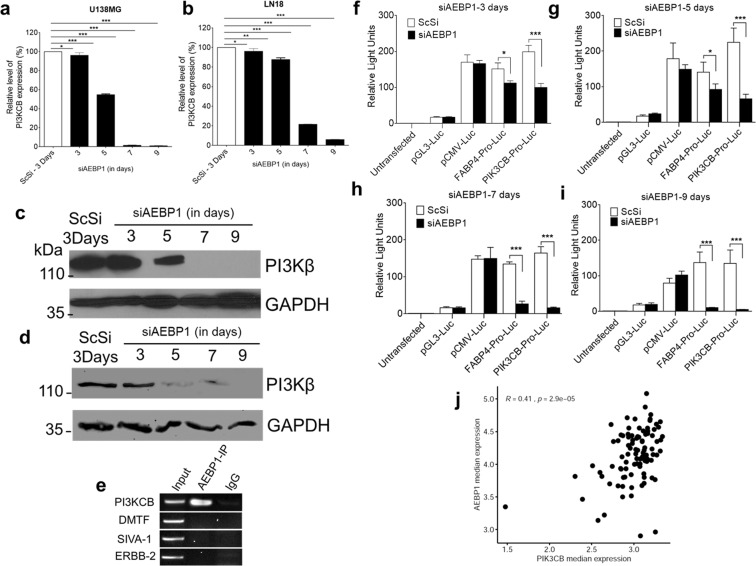
Figure 5.
AEBP1 positively regulates PI3KCB. (a,b) qRT-PCR for PI3KCB expression in ScSi control and siAEBP1 treated U138MG (a) and LN18 (b) cells. *p < 0.05 and ***p < 0.0001. (Scrambled (ScSi) versus siAEBP1 treated cells). One-way ANOVA followed by Dunnett’s test was used to evaluate the statistical differences. The data are expressed as mean ± SD (n = 3). (c,d) Western blot analysis of PI3KCB upon AEBP1 down regulation in U138MG (c) and LN18 (d) cells. The 5th day lane shows decrease in PI3KCB signal which is completely absent in post 7th day of siAEBP1 transfected cells. ScSi treated cells was used as a negative control. (e) ChIP-PCR of PI3KCB promoter sequence (−2Kb) showing AEBP1 interaction with the PI3KCB promoter in U138MG cells. DMTF, SIVA-1 and ERBB2 gene promoter loci were used as negative controls. (f–i) Luciferase reporter assay driven by PI3KCB promoter in U138MG cells upon silencing of AEBP1 for different time periods of time. Cells were transfected with constructs of pGL3-Luciferase Basic vector containing one of the following: CMV promoter, promoter region of the gene FABP4 (transcriptionally repressed by AEBP1), and PI3KCB promoter region. Luciferase assay was performed at different time points after siAEBP1 treatment. *p < 0.05 and ***p < 0.0001. (Scrambled (ScSi) versus siAEBP1 treated cells). One-way ANOVA followed by Dunnett’s test was used to evaluate the statistical significance. The data are expressed as mean ± SD (n = 3). (j) Correlation between AEBP1 and PIK3CB expression levels in GBM patients in relation to normal brain tissues retrieved from TCGA database through cBioPortal (http://www.cbioportal.org/). White dots refer to individual GBM patients. r - Pearson correlation coefficient and p – statistical significance.

