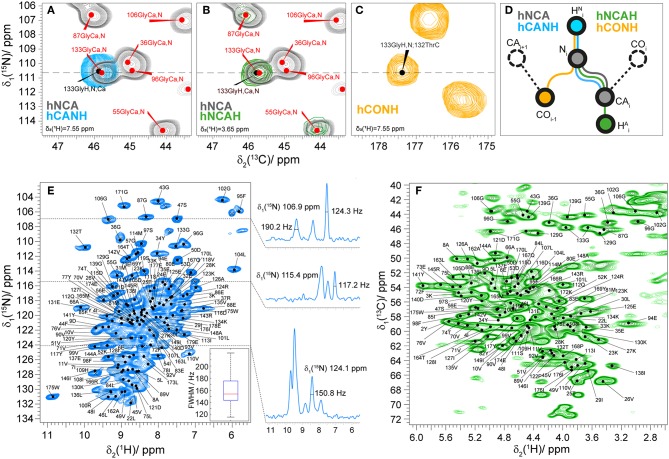
Figure 3.
(A) 2D NCA spectrum (gray) and 2D plane of a 3D hCANH (cyan) spectrum at δ(1H) = 7.6 ppm showing an example of the assignment transfer for 133Gly; (B) 2D NCA (gray) spectrum and 2D plane of a 3D hNCAH (blue) spectra at δ(1H) = 3.7 ppm showing the example of the assignment transfer for 133Gly; (C) 2D plane of hCONH spectrum δ(1H) = 7.6 ppm; (D) schematic representation of the assignment transfer for HN and Hα atoms; (E) 2D hNH correlation spectrum of fully protonated Rpo4/7* at 110 kHz MAS. The spectrum includes labels for the 15N-1H peaks as predicted from the manually created shift list. On the right side of the figure 1D traces for 1H are presented at the corresponding 15N frequencies. The 1H linewidth characteristics of the full population of marked cross-peaks are summarized in the boxplot in the bottom right, indicating the maximum, 3rd quartile, mean, 1st quartile and minimum value of proton FWHM linewidth in Hz with a mean value of 160 ± 40 Hz. (F) 2D hCH correlation spectrum of fully protonated Rpo4/7* at 110 kHz MAS with peaks labeled as in (E).

