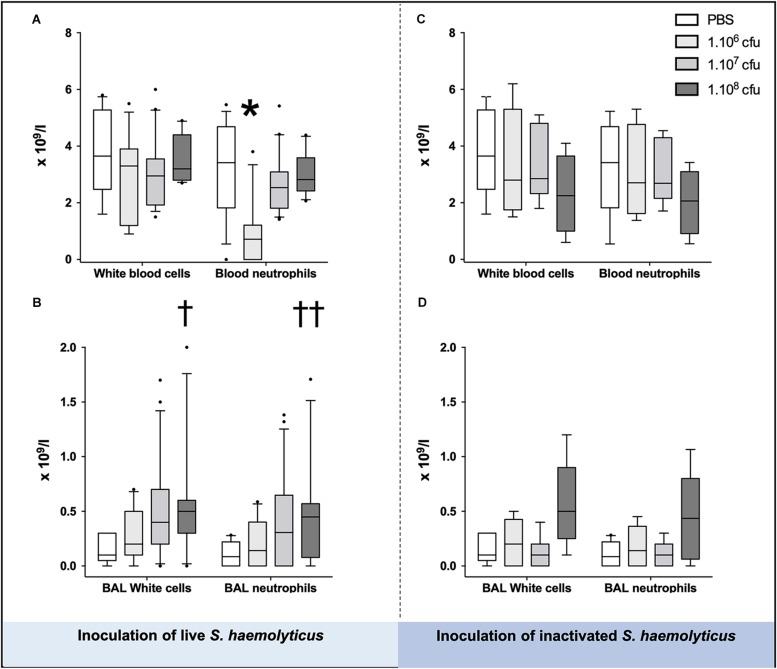
FIGURE 3.
White cells and neutrophils in the blood (A,C) and BAL (B,D), 36 h following tracheal inoculation of phosphate-buffered saline (PBS), live and inactivated S. haemolyticus. Median values, interquartile 25th–75th range and extreme values (>2 SD) are represented. Blood neutrophils were significantly different between groups: Kruskal–Wallis p = 0.0095; ∗ indicates p < 0.05 for 106 CFU versus PBS and 107 CFU; BAL White cells were significantly different between groups: Kruskal–Wallis p = 0.0023; †indicates p = 0.0013 for 108 CFU versus PBS; BAL neutrophils were significantly different between groups: Kruskal–Wallis p = 0.01; ††indicates p = 0.0084 for 108 CFU versus PBS.

