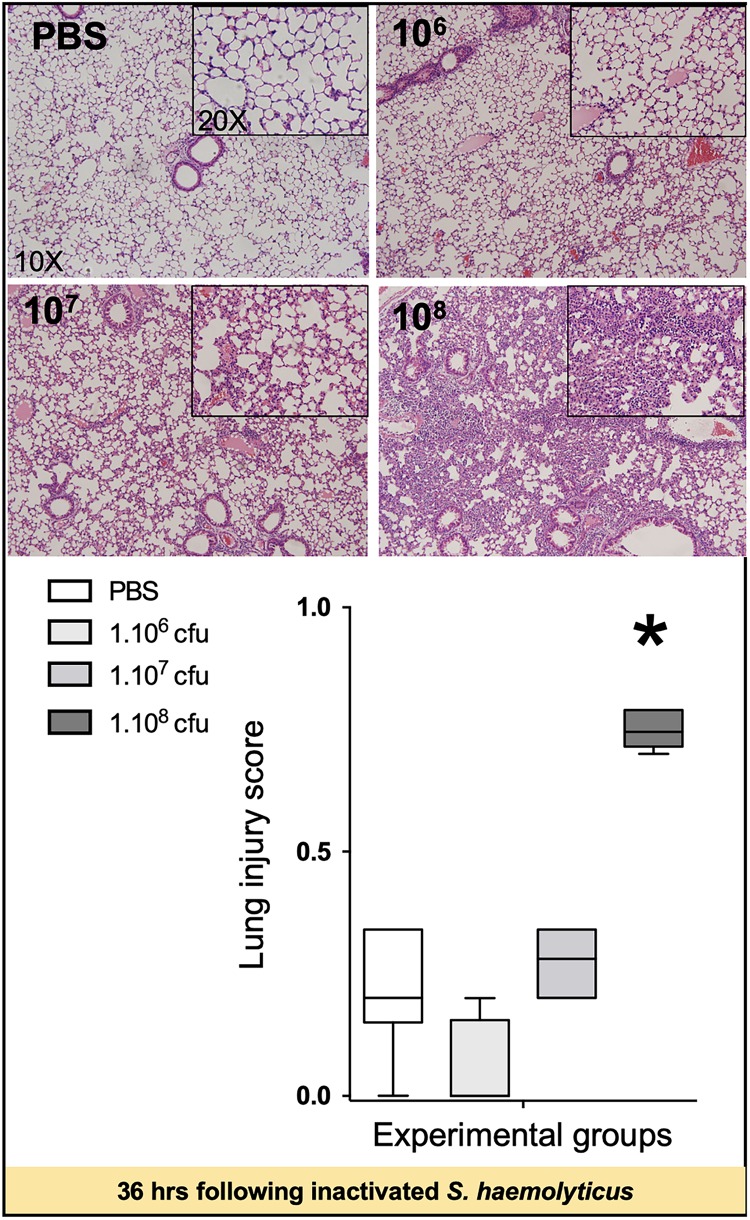
FIGURE 5.
Lung histology 36 h following tracheal inoculation of PBS and inactivated S. haemolyticus at increasing load 106, 107, and 108 CFU. LIS is represented as median values and interquartile 25th–75th range and extreme values (>2 SD). LIS is significantly different between groups: Kruskal–Wallis p = 0.0004; ∗indicates p < 0.05 for 108 CFU versus PBS and 106 CFU. Thirty-six hours after tracheal inoculation of inactivated S. haemolyticus at 106 and 107 CFU, inflammatory cells infiltrate interalveolar septae, respecting alveolar space and lung architecture. The inoculation of 108 CFU of inactivated S. haemolyticus induced invasion of inflammatory cells within alveolar space, hyaline membrane formation, and lung consolidation.

