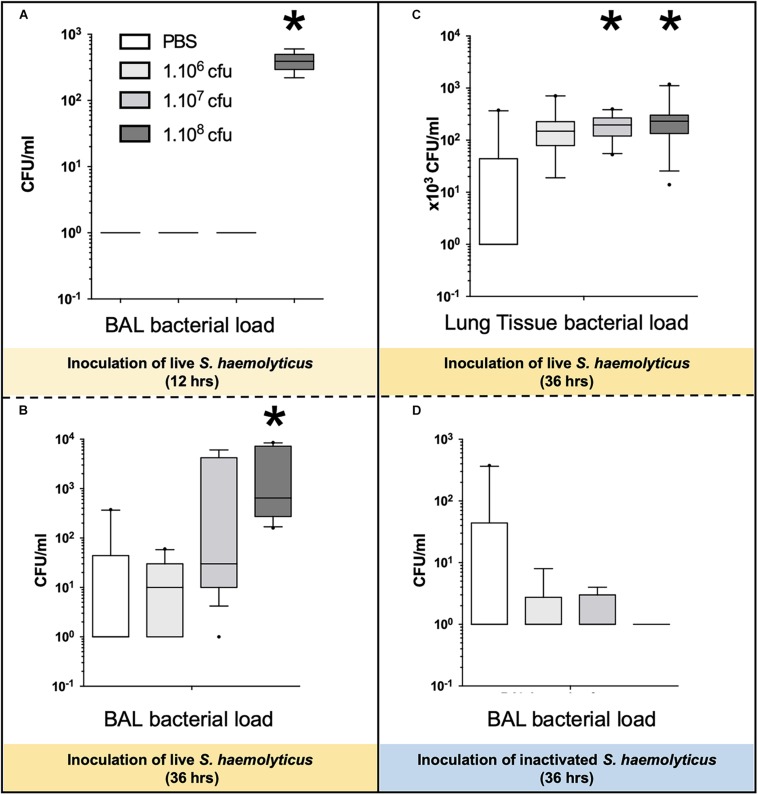
FIGURE 8.
Bacterial load in BAL and lung tissue homogenate following tracheal inoculation of PBS, and increasing inocula (106, 107, and 108 CFU) of live and inactivated S. haemolyticus. Data are expressed as median values, interquartile 25th–75th range and extreme values (>2 SD). (A) Kruskal–Wallis p = 0.002; ∗indicates p < 0.05 for 108 CFU versus PBS and 106 CFU; (B) Kruskal–Wallis p = 0.04; ∗indicates p = 0.046 for 108 CFU versus 106 CFU; (C) Kruskal–Wallis p = 0.003; ∗indicates p < 0.05 for 108 CFU and 107 CFU versus PBS. (D) No significant differences of bacterial colonies in BALF among the inactivated S. haemolyticus groups.

