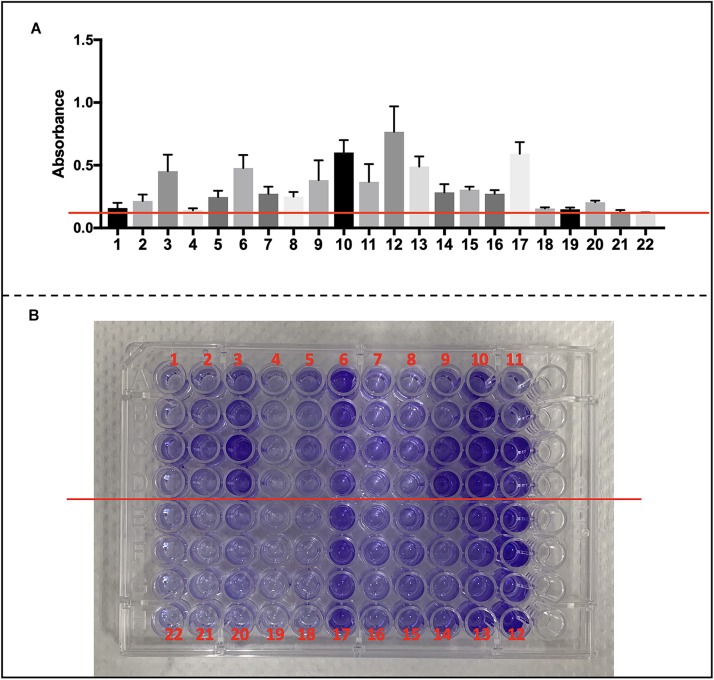
FIGURE 9.
Biofilm formation of CoNS strains and detection of biofilm-associated genes. (A) Data are shown in mean ± SD. Mean level of absorbance of wells was measured spectrophotometrically at 570 nm by a microplate reader after staining by crystal violet (red cross line shows cutoff value = 0.12). (B) Images of wells represent each strain in crystal violet-stained microplates.

