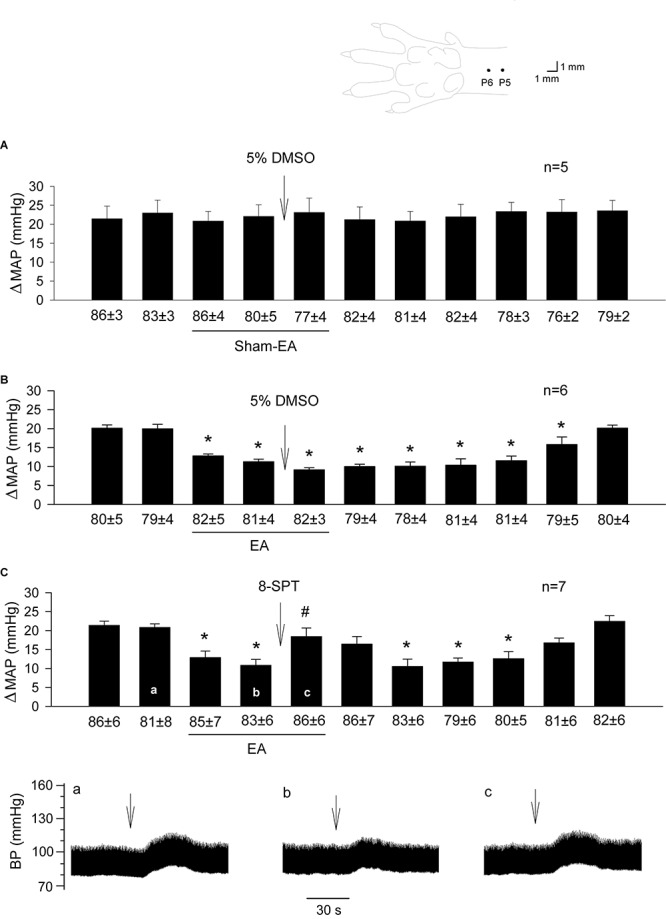
FIGURE 1.

Influence of blockade of adenosine receptors in the rVLM on EA modulation of GD-induced pressor reflexes. The diagram above bar graphs displays the sites of the P5 and P6 acupoints (Hua, 1994). Bars represent increases in mean arterial blood pressure (MAP) following GD. Values below each bar indicate the baseline MAP (means ± SE) before GD. (A,B) 5% DMSO (50 nl) was injected into the rVLM as sham-EA (A) or EA (B) was conducted at P5-6; (C) microinjection of 8-SPT (10 mM in 50 nl; a non-selective adenosine receptor antagonist) into the rVLM with EA treatment. ∗P < 0.05, a decrease of GD response after the onset of EA; #P < 0.05, after vs. before microinjection into the rVLM. Labels a-c in (C) indicate examples of the original BP tracings of a rat; ↓, time of GD application. These data suggest that adenosine in the rVLM is involved in EA modulation of GD-induced pressor reflexes.
